- IELTS Scores
- Life Skills Test
- Find a Test Centre
- Alternatives to IELTS
- All Lessons
- General Training
- IELTS Tests
- Academic Word List
- Topic Vocabulary
- Collocation
- Phrasal Verbs
- Writing eBooks
- Reading eBook
- All eBooks & Courses
- Sample Graphs

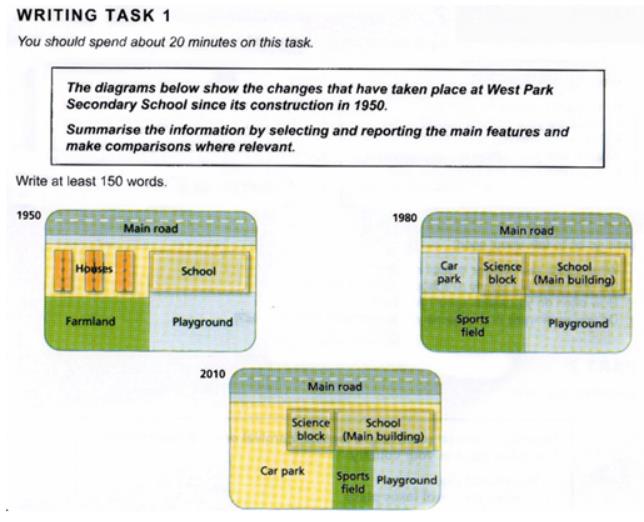
IELTS Writing Task 1 Samples
Here you will find IELTS Writing Task 1 Samples for a variety of common tasks that appear in the writing exam.
The model answers all have tips and strategies for how you may approach the question and comments on the sample answer.
It's a great way to help you to prepare for the test.

The amount of money that a children's charity located in the USA spent and received in one year, 2016.
Model Answer >>>

The Proportions of Pupils Attending Four Secondary School Types Between Between 2000 and 2009.
The city of Brandfield. City planners have decided to build a new shopping mall for the area, and two sites, S1 and S2 have been proposed.

Process Diagram
The process that is used to manufacture bricks for the building industry.

The components of GDP in the UK from 1992 to 2000.

The scores of teams A, B and C over four different seasons.

The electricity generated in Germany and France from all sources and renewables in the year 2009.

British Emigration to selected destinations between 2004 and 2007.

Line and Bar Chart
Visits to and from the UK from 1979 to 1999, and the most popular countries visited by UK residents in 1999.

Thefts per thousand vehicles in four countries between 1990 and 1999.

Pie and Bar Chart
The percentage of persons arrested in the five years ending 1994 and the most recent reasons for arrest.

The different modes of transport used to travel to and from work in one European city in 1960, 1980 and 2000.

The proportion of monthly household income five European countries spend on food and drink, housing, clothing and entertainment.

How chocolate is produced.

The monthly spending in dollars of a family in the USA on three items in 2010.

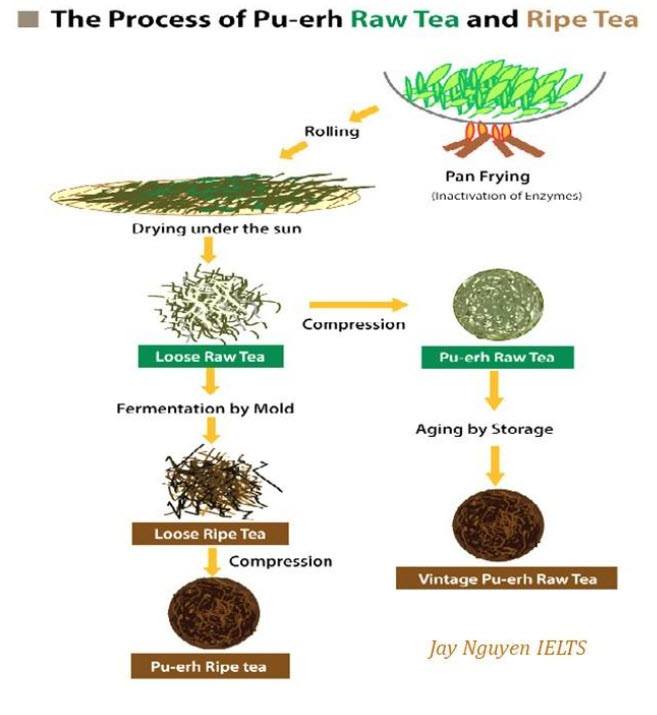
How tea leaves are processed into five tea types.

Pie and Bar Chart
The percentage of women in poverty and the poverty rates by sex and age in the United States in 2008.

Line and Pie Chart
The number of books that were borrowed in four different months in 2014 from four village libraries, and the pie chart shows the percentage of books, by type, that were borrowed over this time.

Four countries of residence of overseas students in Australia

Development of the village of Ryemouth between 1995 and present.

Public Sector Employment in 2015 and 2020.

Cultural Activities of Differing Age Groups

Construction of Tourist Facilities on an island.

Average House Price Comparison.

Average carbon dioxide (Co2) emissions per person

Leisure Activities amongst Australian children.

Structure used to generate electricity from wave power.

Bar & Pie Chart
Men and women attending various evening courses

Changes to Grange Park.

Populations in Yemen and Italy.
Student Sample Graphs
You can also view graphs that have been written by students in the forums:
- Student Graphs
Any comments or questions about this page or about IELTS? Post them here. Your email will not be published or shared.
Band 7+ eBooks
"I think these eBooks are FANTASTIC!!! I know that's not academic language, but it's the truth!"
Linda, from Italy, Scored Band 7.5

Bargain eBook Deal! 30% Discount

All 4 Writing eBooks for just $25.86 Find out more >>
IELTS Modules:
Other resources:.
- Band Score Calculator
- Writing Feedback
- Speaking Feedback
- Teacher Resources
- Free Downloads
- Recent Essay Exam Questions
- Books for IELTS Prep
- Useful Links

Recent Articles
Selling a Mobile Phone to a Friend
Sep 15, 24 02:20 AM
Tips and Technique for IELTS Speaking Part 1
Sep 14, 24 02:41 AM

Grammar in IELTS Listening
Aug 22, 24 02:54 PM
Important pages
IELTS Writing IELTS Speaking IELTS Listening IELTS Reading All Lessons Vocabulary Academic Task 1 Academic Task 2 Practice Tests
Connect with us
Before you go...
30% discount - just $25.86 for all 4 writing ebooks.

Copyright © 2022- IELTSbuddy All Rights Reserved
IELTS is a registered trademark of University of Cambridge, the British Council, and IDP Education Australia. This site and its owners are not affiliated, approved or endorsed by the University of Cambridge ESOL, the British Council, and IDP Education Australia.
IELTS Academic Writing Task 1 – Sample Answers

It is important for you to look at sample essays when you are studying to see if your work is on the way to becoming a band score 7 or higher.
Sample Essay 1 – Pie Charts
The pie charts show the ratio of goods shipped from Great Britain from 2010 to 2015. The products are measured by percentage.
On the other hand, the diagrams illustrate an increasing rise in the production of plastics at over 4% since 2010. Furthermore, the most relevant feature is the increase in the export of organic chemicals from 2010 (7%) to 2015 (10%). There is a huge difference in the production of pharmaceuticals, due to the fact that it experienced a decrease from 2010 (27%) to 2015 (18%).
Sample Essay 2 – Line Graph Showing Future Trends
The line graph presented depicts the loan status of the Royal Bank of Scotland between the years 2012 to 2022. It is measured in millions of pounds sterling.
Firstly, it is clear that student loans and mortgages are following a very similar pattern over the years. Student loans stood at just under 1.500 million in 2012, noticeably, being the highest of the four groups. Though they remained constant up to 2013, they are expected to climb steadily to approximately 2.5 billion in 2022. Like the student loans, mortgages are predicted to follow a similar pattern and increase.
Finally, personal loans were staged at the lowest level of the four groups, at under 500 million in 2012. Despite climbing up and overtaking auto loans briefly in 2016 to about 800 million, this level will continue decreasing until 2022 to 400 million.
(Word Count = 223 / Band Score 9)
Sample Essay 3 – Process
To begin, a body of water is stored in a large water reservoir holding the water until it goes into the intake. The dam will then control the flow of water to the intake. After that, water will flow to a cylindrical passage called a penstock, making it flow with a strong pressure until it reaches the turbine. Next, the current of the flowing water from the river passing through the penstock will maintain the turbine’s rotation.
Sample Essay 4 – Line Graph
Sample essay 5 – table, writing task 1 band score 9 criteria >>, ielts writing task 2 question types, related posts, write to the singer about his/her performance: semi-formal letter [ielts general writing task 1 ], ielts writing task 1 – line graph essay 1, leave a comment cancel reply.
- Skip to primary navigation
- Skip to main content
- Skip to primary sidebar
- Skip to footer
IELTS Advantage
IELTS Preparation Courses
IELTS Writing Task 1: Everything You Need to Know
Ielts writing task 1 in 6 simple steps.

Academic Writing Task 1 Strategy
- Understand how the test is marked. Knowing the marking criteria will allow you to give the examiner exactly what they need.
- Paraphrase the question. It is best to paraphrase the question in the first paragraph. You can do this by using synonyms.
- Write the overview. To write your overview , pick 3 or 4 of the main features and write about them generally without referencing any data.
- Support the main features. In a new paragraph, support the key features with the data in the information given to you.
- Check your work. Check your report for spelling and grammar mistakes. Make sure that the data you mentioned is also accurate!

Essential Writing Task 1 Skills
- How to Write an Overview Paragraph
- How to Paraphrase
- How to Write a Complex Sentence
- How Many Words?
- Task 1 Charts Checklist
- Task 1 Tips
- The Danger of Synonyms
- 6 Common Mistakes
- Paragraphing and Editing
Writing Task 1 Full Lessons
- Writing Academic Task 1 in 5 Easy Steps
- Charts Lesson
- Maps Lesson
- Multiple Charts/Graphs
- Process Lesson

Academic Task 1 Sample Answers

- Bar Chart Sample Essay (Cars in Asia)
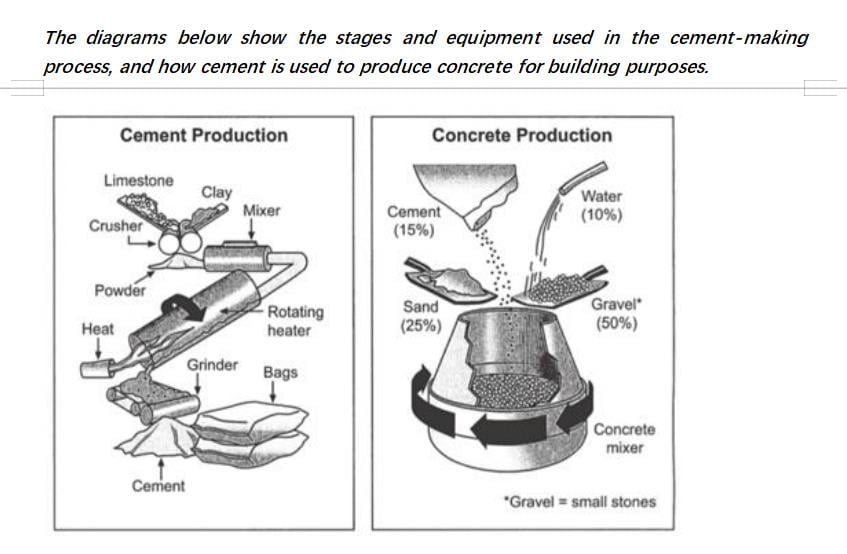
- Process- Cement and Concrete Production
- Pie Chart (Italy and Yemen Populations)
- Process Question
- Bar Chart Question (UK Telephone Usage)
- Line Graph (US Consumption of Energy)
- Bar Chart Sample Answer (International Students)
General Training Writing Task 1

General Training Writing Task 1 in 5 Simple Steps
- Understand how the test is marked. Knowing the marking criteria is the best way of giving the examiner exactly what they need and nothing else.
- Decide whether the letter is formal or informal. This part is easy. If the question asks you to write to a ‘friend’, it should be an informal letter. If the question asks you to write to anyone else, it should be a formal letter. It is that simple!
- Discuss each bullet point from the question. Make sure to take a new paragraph for each bullet point. This will make your letter easy to read and understand.
- Sign off your letter. Don’t overcomplicate this part. Include a sign-off suitable to your letter’s tone and write your name beneath.
- Check your work. Make sure your letter doesn’t contain any grammar or vocabulary mistakes.
- Letter Writing Tips
- How to Write an Informal Letter
- How to Write a Formal Letter
General Training Essential Writing Task 1 Skills
- Task 1 General Training Writing Strategy
- Task 1 General Training Writing Guide
Sample Answers
- Formal and informal sample letters.
Writing Task 1 Essential Information
- People doing the Academic test will write a report on a data set, map, or process. People doing General Training will write a letter.
- You must write 150 words or more.
- You should spend around 20 minutes on this part of the test.
- Task 1 is worth 1/3 of your total mark on the Writing test.
- You will be assessed in four areas: Task Achievement (25%) Coherence and Cohesion (25%) Lexical Resource (25%) Grammatical Range and Accuracy (25%)
- The most important thing is that you can demonstrate that you can clearly communicate in English.
- The key to doing well is to know exactly what the examiners want and give it to them.
- Grammar and Vocabulary Guide

- Top 10 Grammar Mistakes
IELTS Writing Task 1 FAQs
How can i improve my writing.
You will find all the resources you need on our Writing Task 1 page. Click the link below:
Writing Task 1
If you need serious help or personalised feedback, you should check out our online course. There is a waiting list, but you can add your name here:
How can I get a Band 7, 8 or 9?
The answer to this question is different for every individual IELTS student, as it depends on a number of factors, including your work ethic, English skills and exam strategy. You'll find a guide to answering this question in this article
If you need serious help with improving your IELTS scores, you should check out our online writing course. There is a waiting list, but you can add your name by clicking the link below:
Can you correct my writing?
Please click the link below and it will give you all the information you need about our writing correction service:
Writing Correction Service
Do you have any sample answers?
Yes, you will find them at the link below:
Task 1 Sample Answers
Will using 'high level' or 'academic' words help me improve my score?
Probably not.
Read my recent article about IELTS vocabulary here:
5 Things You Need to Know about IELTS Vocabulary
How many paragraphs should I write?
Introduction
You can put the overview at the end if you'd like.
Can I use idioms?
No, you should typically avoid using idioms in Writing Task 1.
The only time this is acceptable is if you are taking the General Training test and must write an informal letter.
Should I write a conclusion for Task 1 Academic?
No. A conclusion is a summary of YOUR ideas and your opinion. Task 1 is simply reporting what you see, so there shouldn't be any of your ideas or your opinion.
Instead of a conclusion, you should write an overview.
The reason lots of people get confused about this is that some teachers, books and even one British Council website call the overview a 'conclusion'. It's not a conclusion, it's an overview.
Finally, it does not matter where you put the overview paragraph. We teach our students to put it after the introduction, but it is also fine to have it as your final paragraph.
How many words should I write?
You must write at least 150 words in Writing Task 1 (yes, the examiners will count them!)
I would suggest that you aim to write around 160-170 words for Task 1. Aiming for 20-30 words more than the required amount makes you more likely to reach the word limit without setting an unrealistic goal.
Will I lose marks if I don't write enough words?
Yes. If you don't write the required number of words, you will lose marks in 'Task Achievement' for not answering the question fully. Read more here .
Can I use contractions?
No, should not use contractions when you are writing an academic essay or formal letter. However, it is fine to use contractions in an informal letter.
When should I write formally?
There are a few signposts that indicate when you should write formally or informally. Watch our video lesson to find out what they are:
IELTS Writing Task 1 General Training: Formal or Informal Letters?
- Skip to main content
IELTS Podcast
Pass IELTS with expert help.
IELTS Academic task 1
Here on IELTS Podcast, you will find useful IELTS Academic writing task 1 tips, tutorials, sample essay questions and answers to help you prepare for your Academic task 1 exam.
How much time should I spend on IELTS writing task 1 in the IELTS test?
The IELTS writing exam is divided into two sections . You have an hour to write both. Since task 1 makes up 33% of the test you should plan to spend 20 minutes on this section to ensure that you make effective use of your time.
IELTS Task 1 Marking criteria
Task 1 is marked according to the following:
- Task achievement (25%)
- Cohesion and coherence (25%)
- Vocabulary (25%)
- Grammar (25%)
IELTS Graphs, Charts or Diagrams

Academic writing task 1 requires that you summarise and compare a diagram, chart or graph, talking about the main features.
You should use at least 150 words for the task. This section is not an essay. It is a summary. You should use formal language and it must factual.
Academic writing task 1 is a report on a bar chart , pie chart, table, map diagram or process. Below we have tutorials, guiding you on how to answer the different task 1 questions.
- How to describe a process diagram
- How to describe a pie chart
- Task 1 line graph sample essay
- How to describe a bar graph
- How to describe a flow chart
- Describing a map for task 1
- Dynamic and static charts and the language of overviews
- How to describe a table of figures
- Describing a natural process
- How to describe a bar chart
- How to describe an image
- Describing a graph with numbers
- Writing tips for academic task 1
Summarise and Compare
Read the question carefully. Academic writing task 1 may contain two to three charts which may be a line graph , a table, a pie chart , a map , a diagram or a bar chart . To do well in this task you need to take a general overview of the task.
A good description will look at trends, at highs and lows and at the times that these occurred – beginnings and endings in other words. You need to describe the key features and changes in the graphs. That means just talk about the main features and don’t try to describe everything! A great tip is to use superlatives. For example:
The most expensive item was…
The largest amount spent was…
The lowest point was…
Another useful tip for IELTS writing task 1 is to find things that were the same or similar, then contrast them with what was different. For example,
‘Sales of both sugar and salt increased during the period shown, reaching their highest prices in November. In contrast, sales of coffee fluctuated significantly.’
The Process
Start off by looking at the graphs to determine what you need to summarise and compare. Write an introduction of one to two sentences. Then offer a general overview, describing trends. The next paragraphs should get into the specifics, grouping your information according to the main features and then describing each of them.
Always bear in mind that this is a test of your English-speaking abilities. Use the appropriate vocabulary . Try to showcase as much of your vocabulary as possible and make sure that your English grammar is immaculate. Write at least 150 words – this cannot include copying any of the information from the question word for word. Paraphrasing several words in a sentence is fine.
Preparing for the Exam
The best way to prepare for the exam is to get plenty of practice beforehand. First, look at some excellent essay examples for writing task 1. There are quite a few useful links at the end of this article. Find a style or model you like and try to use some of the same phrases to describe a similar diagram, remembering to write at least 150 words. Try your hand at describing and comparing various diagrams and graphs. Send them in for an evaluation and learn from the outcomes.
Useful links to help you prepare for academic task 1:
Frequently Asked Questions
Which articles should i read first.
We are here to help! There are lots of articles that can give you help and tips for specific IELTS writing task 1 types, and also more general information about writing task 1.
Make sure you don’t look at General Training articles though, because writing task 1 for General Training will not be the same.
Here are some of our favourites:
- How to get band 9 in task 1
- 5-step plan for task 1
- How to paraphrase in task 1
- Academic task 1 marking criteria
- Five essential writing skills for task 1
- What tense to use in task 1
- How to describe percentages
- Vocabulary to describe a map
Sample IELTS Writing task 1 Questions and Essays
- IELTS Writing Task 1 Vocabulary List With Examples
- Academic task 1 sample essays and answers
- Task 1 sample charts and graph questions
- Academic task 1 sample diagram questions
- How to score well on a bar chart question in writing task 1
- IELTS academic task 1 sample question
- IELTS academic task 1 sample question – bar chart showing interest
- IELTS Academic writing task 1 question – pie chart showing usage
IELTS Writing Task 1 – Sample Questions and Practice Resources

On the IELTS Academic exam, Writing Task 1 requires you to look at an informational graphic and describe the contents of the graphic in writing. In this post, we’ll look at different IELTS Writing Task 1 samples to prepare you for test day. In addition to advice and practice, you’ll also get our IELTS Writing Task 1 Examples PDF with Answers for portable prompts and model answers.
IELTS Academic Writing Task 1 Samples With Answers PDF
If you want a print-friendly version of the IELTS Writing Task 1 samples in this post, click below to access the IELTS Writing Task 1 examples PDF!

Note that all the IELTS Writing Task 1 samples are model essays for a band 9 IELTS score. The line graph sample prompt includes a detailed scoring explanation. You can learn more about scores for IELTS Writing Task 1 by consulting the official IELTS rubric .
- Take a good look at our guide to IELTS Writing Task 1 paragraph structure . The guide tells you everything you need to know about how Writing Task 1 essays and paragraphs should be structured, with an example question and model essay.
IELTS Writing Task 1 Samples: The Major Question Types
Below are questions for each common infographic in IELTS Writing Task 1: bar charts, pie charts, line graphs, process diagrams, and maps.
IELTS Academic Writing Task 1: Line Graph with Model Answer and Scoring Explanation

[/threecol_one_last]
IELTS Academic Writing Task 1: Bar Chart With Model Answer

Pie Chart with Model Answer

Process Diagram with Model Answer

IELTS Academic Writing Task 1: Map with Model Answer

IELTS Academic Writing Task 1: Two Different Types of Graphics

| TOWN | AVERAGE ANNUAL RAINFALL (1971-2000) |
|---|---|
| Kainaliu | 138.38 |
| Opihihale | 97.53 |
| Holualoa | 110.48 |
[/threecol_two][threecol_one_last]
Additional Resources for Writing Task 1
Now that you’ve seen some models for how this task is done, you should be ready for some real practice! Here are some resources from Magoosh that should help.
- Practicing using these common IELTS Writing Task 1 and Task 2 linking words .
- Familiarize yourself with the test with IELTS Academic Writing Task 1: Ultimate Guide video , and use a Writing diagnostic quiz to assess your current strengths and weaknesses.
- Use study schedules to help you find time to study and stay motivated. To help you organize your time, use this IELTS study schedule if you only have a week to go before you will take the IELTS. If you have a month, this one month IELTS study schedule offers more extended practice.
- Find high-quality study materials. We offer a huge collection of study reources for the whole IELTS Writing seciton ! Don’t forget about Magoosh IELTS Prep which includes lessons on IELTS Writing Task 1 (and all other sections of the exam!) to help you prep smarter. In addition to many video lessons and practice essays, the 6-month plan allows students to get feedback and scoring on four practice IELTS Writing essays; the 1-month plan includes feedback on one essay. You can also browse more recommended books and resources !

David is a Test Prep Expert for Magoosh TOEFL and IELTS. Additionally, he’s helped students with TOEIC, PET, FCE, BULATS, Eiken, SAT, ACT, GRE, and GMAT. David has a BS from the University of Wisconsin-Eau Claire and an MA from the University of Wisconsin-River Falls. His work at Magoosh has been cited in many scholarly articles , his Master’s Thesis is featured on the Reading with Pictures website, and he’s presented at the WITESOL (link to PDF) and NAFSA conferences. David has taught K-12 ESL in South Korea as well as undergraduate English and MBA-level business English at American universities. He has also trained English teachers in America, Italy, and Peru. Come join David and the Magoosh team on Youtube , Facebook , and Instagram , or connect with him via LinkedIn !
View all posts
More from Magoosh

Leave a Reply Cancel reply
Your email address will not be published. Required fields are marked *
IELTS Writing Task 1: Question Types, Evaluation Criteria and Tips
Share on Whatsapp
Share on Email
Share on Linkedin

Limited-Time Offer : Access a FREE 10-Day IELTS Study Plan!
“Explore this comprehensive guide on IELTS Writing Task 1 and learn how to improve your writing skills and avoid common mistakes to achieve that band score! “
Interpreting visual data and summarizing information accurately is a vital skill for higher education and global communication and this skill is evaluated in IELTS Writing Task 1 exam. It is, thereby, a crucial component of both the Academic and General Training modules.
In this comprehensive guide, we will examine all aspects of IELTS Writing Task 1, exploring its different formats, question types with IELTS exam examples, tips for success, and common mistakes to avoid.
Understanding IELTS Writing Task 1
Task 1 of IELTS Writing assesses the candidate's ability to interpret and present information in a clear and coherent manner. It requires candidates to describe visual information or frame a letter in a minimum of 150 words in 20 minutes. The key skills tested in Task 1 include:
- Understanding Visual Data or Prompts: Candidates must accurately interpret the visual data provided or prompts for letters and convey the main trends, comparisons, and significant points accurately.
- Organizational Skills: Structuring the response effectively is essential, including introducing the topic, providing an overview or a purpose, and presenting key details logically.
- Language Accuracy: Candidates are evaluated on their ability to use a range of vocabulary, grammatical structures, and cohesive devices to express ideas precisely.
IELTS Writing Writing Task 1 Question Types
You have to keep in mind that Task 1 differs for both IELTS General and Academic purposes. So, the different types of questions in these two types of IELTS exam are given below.

IELTS Academic Writing Task 1
You will be required to represent data relevant to an academic context that are shown in one or more figures, such as graphs, charts, tables, diagrams, or processes in Task 1 of IELTS Academic . There are typically seven types of questions in IELTS Writing Task 1 Academic:
- IELTS Table chart
- IELTS Bar chart
- IELTS Line graph
- IELTS Pie chart
- IELTS Map Diagram
- IELTS Process diagram
- Combination (Mixed) charts
For a deeper comprehension of the subjects, it is crucial to regularly practice using the IELTS writing task 1 practice tests with answers.
Get set to take a look at the IELTS Academic Writing Task 1 question types with band 9 sample answers now!
Table Chart Sample
|
|

Sample Answer
The table compares the oil production in four different African countries, Nigeria, Chad, Congo Brazzaville, and Cote d’Ivoire from 2000 to 2004.
Overall, it can be seen that Nigeria registered the highest oil production in all the years. Also, while the oil production in Chad and Cote d’Ivoire increased, it fell in Congo Brazzaville and fluctuated in Nigeria.
There was no oil production in Chad from 2000 to 2002. In 2003, Chad produced about 50,000 barrels, and this increased and reached 290,000 barrels in 2004. Similarly, Cote d’Ivoire’s production also increased from 8000 barrels in 2000 to 45,000 barrels by 2004. On the other hand, the production of oil in Congo Brazzaville decreased continuously. In 2000, 280,000 barrels of oil were produced in Congo and its production fell by 10,000-20,000 barrels year by year and reached 205,000 barrels in 2004.
Finally, oil production in Nigeria varied. In 2000, 2,000,000 barrels were produced and this increased slightly to 2,100,000 by 2001. However, in the next year, production fell by 200,000 barrels. From 2002 onwards production increased continuously and in 2004, a production of 2,200,000 barrels was recorded.
Bar Chart Sample

The bar graph compares the spending of 18-20-year-olds on food, clothes, books, smartphones, and toiletries in 2010 and 2014 in a particular country.
Overall, it can be seen that the spending on all the products except books and clothes rose with time. Furthermore, the maximum spending was done on food in both years.
In 2010, the 18-20-year-olds spent roughly 3700$ million on food, which was followed by clothes at about 2500$ million dollars. Smartphones and toiletries accounted for about 2000$ million in spending each. The least expenditure was done on books, with a figure of only $1000 million.
In the next four years, the expenditure on food, smartphones, and toiletries increased and in 2010, about $4300 million was spent on food, whereas about $2700 million was spent on smartphones. The amount spent on toiletries rose minimally by about $100 million. By contrast, the spending on books became nearly half. Lastly, the expense of clothes remained unchanged at $2500.
Pie Chart Sample

The pie chart depicts the average electricity usage in a typical English household. The highest proportion of energy consumption, amounting to 52.5%, is attributed to heating rooms and water.
Overall, the chart shows the electricity consumption in a typical English home. Most energy is devoted to heating, followed by kitchen appliances, while the remaining portion is divided between essential and less frequently used household items.
This significant allocation can be attributed to the unpredictable weather patterns in the UK, where temperatures rarely exceed 20 degrees Celsius during the summer compared to other European countries experiencing temperatures above 25 degrees Celsius. Consequently, households in these countries utilize less electricity during the summer months. Kitchen appliances, including ovens, kettles, and washing machines, account for the second largest portion of British electricity usage, representing 17.5% of total household energy.
The remaining 30% of electricity is divided equally. Half of this share is utilized by essential appliances like house lighting, televisions for entertainment, and radios for music, which are integral components of our daily lives. The other half of the 30% is consumed by appliances such as vacuum cleaners, food mixers, and electric tools, which are typically used weekly.
Line Graph Sample

The graph shows changes in the birth and death rates in New Zealand since 1901, and forecasts trends until 2101.
Overall, these opposing trends mean that the death rate will probably overtake the birth rate in around 2041 and the large gap between the two levels will be reversed in the later part of this century.
Between 1901 and the present day, the birth rate has been consistently higher than the death rate. It stood at 20,000 at the start of this period and increased to a peak of 66,000 in 1961. Since then the rate has fluctuated between 65 and 50 thousand and it is expected to decline slowly to around 45,000 births by the end of the century.
In contrast, the death rate started below 10,000 and has increased steadily until the present time. This increase is expected to be more rapid between 2021 and 2051 when the rate will probably level off at around 60,000, before dropping slightly in 2101.
Process Diagram Sample

The given diagram shows different stages of brick manufacturing for the building industries.
Generally speaking, overall the brick production involves 7 steps, starting from the digging stages and ending at the delivery stage.
As is given in the graph, the first step of brick manufacturing is digging the clay with a large digger. This clay is then filtered and processed in a roller machine and then mixed with sand and water. In the third stage, the mixture is either kept in a mold or cut in a wire cutter to make the raw shape of the bricks. In the next step, the shaped raw bricks are dried for 24 to 48 hours in a drying oven.
After that, the dried raw bricks are kept in a kiln, both at moderate and high temperatures, up to 1300 degree centigrade, and then placed in a cooling chamber for about 48 to 72 hours. This process makes the brick to be packed and delivered in the final two steps. The delivery process is the final process of brick manufacturing and as it is noted, brick-making is a moderately complex process that requires some predefined work to make it usable.
Map Diagram Labelling Sample

The maps illustrate an industrial zone in Norbiton town currently and a proposed redevelopment scheme for the whole area.
Overall, Norbiton will become more residential, so the factories will be demolished to make way for new housing. Moreover, two new roads and a mini roundabout will be built along with new shops, a medical center, and a school.
Looking at the current layout, a main road runs from east to west with a roundabout in the middle, which is surrounded by factories that extend to the east. In the north, farmland is situated over the river. There are currently no houses or other facilities in this industrial zone.
Regarding redevelopment, from the central roundabout a new road will extend north and a bridge is to be constructed over the river with plans for new housing on the farmland. In addition, a road extending northwest with housing and shops is earmarked for construction. Next to the new mini roundabout, a medical center will be built. To the east, a school and playground are proposed with extra residential facilities. Notably, no factories are expected to remain in the plans.
Combination Charts Sample

The bar chart outlines how many Japanese travelled overseas between 1985 and 1995 while the line graph delineates the percentages of these tourists who visited Australia in particular between 1985 and 1994.
Overall, the number of Japanese who made overseas travels soared and this is also true for the Australian visiting travelers from Japan.
As can be seen from the illustration, around 5 million Japanese citizens travelled to different countries in 1985 which kept on increasing each year except in 1991. From approximately 7 million tourists in 1987, it went as high as 12 million in just 6 years. Finally, in 1995, around 15 million Japanese toured foreign countries which was three times higher than that of a decade earlier.
The line graph shows that 2% of Japanese tourists reached Australia in 1985 and with a steady increase this figure went as high as roughly 5% in 1988. The next year the ratio slightly dipped but went higher each year in the subsequent years. Australia received more than 6% of Japanese travellers in 1993, the highest, which stood at exactly 6% in 1994.
IELTS General Writing Task 1
The candidate must compose a letter outlining details from IELTS GT Writing Task 1 or provide an explanation of a circumstance. There are three types of letters for IELTS General writing task 1:
- IELTS General Writing Task 1 Sample Formal Letters
- IELTS General Writing Task 1 Sample Semi-Formal Letters
- IELTS General Writing Task 1 Informal Letters
Candidates are assessed on their ability to engage in personal contact, elicit and offer general factual information, express needs, likes, and dislikes, as well as their opinions, in the IELTS general writing task 1.
Get set to take a look at the IELTS General Writing Task 1 question types with band 9 sample answers now!
Formal Letter Sample
|
|
I would like to express my regret for having dined at your establishment last night; please allow me to explain. The table was booked two months in advance since it was to cater for a major professional event, and yet we were informed by the maitre d’ upon arrival that there were no tables sufficiently large and we would have to dine separately. I did press this point with your staff as my party needed to remain in each other’s company, but we were told that it was simply impossible to seat us all together.
In addition to this, several menu items were unavailable on the night, including every vegetarian option, meaning that three members of my party were left to eat only bread throughout the meal. As a result of these incidents, I had intended not to pay, but your staff informed us that they would call the police if we refused, and so to avoid further embarrassment, I complied.
This experience was entirely unacceptable, and I would like to request a full refund of the amount paid. I would also suggest that your staff not promise customers the degrees of service that they are unable to provide in order to avoid disappointing experiences such as these ones.
Paul Hollywood
Semi-formal Letter Sample
Dear Rohan,
It has been a while since I spoke to you. I’m writing this letter to inform you that I’ve moved to Brussels to pursue my career as a Senior Consultant in Java at ABC Company. It is one of the prestigious companies here, and I consider myself lucky to have been selected here.
Life is great in Brussels. It has a tremendous maritime temperate climate with summers being warm and winters being cool. Due to its proximity to the Atlantic ocean, it has an almost pleasant weather throughout the year. There is not much snowfall, though. Nearly 70% of the population in Brussels have foreign origins. If circumstances are favorable, I’m planning to stay here at least for the next ten years.
I know you have a strong background in Java, and Brussels has plenty of opportunities for it. I can arrange for an interview at ABC company itself. Please do send me your Resume. Even otherwise, feel free to come here for a holiday. Brussels is such an artistic place.
Looking forward to hearing from you.
Yours truly,
Informal Letter Sample
Dear Reeta,
I got your message that stated your visit to my city. Let me tell you, I am more than excited and elated to receive you. However, I’d like to apologize beforehand for what I am going to say next. The date that you mentioned – 25th February, unfortunately, I am not available on this date.
I have my last exam; thus, I would have to go out of the city for the entire day. If it was not that important, I wouldn’t be asking you not to come. In fact, for months, I was waiting eagerly to meet you.
Why don’t you change the date if possible? I am free anytime after 25th February. You will be more than welcome to stay with me for as many days as you want. We are definitely going to have a fun-filled time together. Once again, I am sorry for this inconvenience. Looking forward to meeting you soon.
Yours lovingly,
Some More IELTS General Writing Task 1 Samples
Here are some latest Writing Task 1 topics with sample answers for IELTS General Training:
Formal Letter
Semi Formal Letter
Informal Letter
Evaluation Criteria for IELTS Writing Task 1
The purpose of the IELTS Writing Task 1 question is to assess a candidate's writing abilities.
- Four criteria are used to assess a candidate's IELTS score: Task Achievement, Coherence & Cohesion in IELTS Writing , IELTS Lexical Resource and IELTS Grammatical Range & Accuracy.
- For IELTS Writing Task 1, each component is worth 25% of the candidate's final score.
Therefore, these are standardized measures that a student needs to follow throughout their answer to achieve their desired IELTS band score . Check the table given below:
| 9 | ||||
| 8 | ||||
| 7 | ||||
| 6 | ||||
| 5 |
Top Tips for Success in IELTS Writing Task 1
Candidates must follow some IELTS preparation tips in order to master IELTS Academic writing task 1 and IELTS GT writing task 1. So, given below are some top tips to structure your answers for IELTS Writing Task 1.
- Understand the Task Requirements: Read the instructions carefully and identify the main features and key trends in the visual data.
- Plan Your Response: Spend a few minutes organizing your ideas before you start writing. This will help you structure your response effectively.
- Use a Variety of Vocabulary: Demonstrate your lexical range by avoiding repetition and employing synonyms to describe the data accurately.
- Focus on Significant Details: Highlight the most important information and avoid including unnecessary details that do not contribute to the overall understanding of the required details.
- Practice Time Management: Allocate enough time to each task and aim to complete Writing Task 1 within the recommended 20 minutes.
- Use Synonyms - Don't just copy words from the prompt. Paraphrase with your own vocabulary.
- Include Units of Measurement - Use measurement units like millions, percentage, tons, dollars. This shows attention to detail and highlights obvious contrasts or similarities between data trends to make logical comparisons.
- Use Linking Words - IELTS Writing Task 1 Connectors add like "while", "in addition", "on the other hand" connect your ideas and show cohesion.
- Stick to Plain English - Don't try to sound overly complex. Keep your language clear and concise.
Common Mistakes to Avoid in IELTS Writing Task 1
While analyzing visuals or framing the letter might seem straightforward, Task 1 can trip you up if you're not careful. Here are some key mistakes to avoid:
- Misinterpreting Data/Prompts: Ensure that you accurately understand the information presented in the visual data before attempting to describe it.
- Ignoring Task Instructions: Pay attention to the specific requirements of each task and avoid straying from the given topic.
- Overlooking Grammar and Spelling: Proofread your response carefully to eliminate grammatical errors and spelling mistakes.
- Lack of Coherence and Cohesion: Ensure that your response is well-structured and cohesive, with clear connections between sentences and paragraphs.
The IELTS Writing Task 1 test may seem challenging, but with dedication and the right strategies, you can conquer it. Remember, consistent practice, a focus on improvement, and a clear understanding of the format are key to achieving your desired band score. If you need any sort of guidance, feel free to interact with our IELTS experts or be a part of IELTS webinars . So, take a deep breath, pick up your pen, and embark on your journey to IELTS writing mastery!
Some More IELTS Academic Writing Task 1 Samples
Check out the recent Writing Task 1 topics with IELTS Writing Task 1 sample answers to practice:
- Village of Stokeford in 1930 and 2010- Map
- Paradise Island Map – IELTS Academic Writing Task 1 Answers
- IELTS Academic Writing Task 1 Example 4 : Development of the village of Rye mouth – Map
- IELTS Academic Writing Task 1 Topic: The development of cutting tools in the stone age – Diagram
- IELTS Academic Writing Task 1 Example 3: Civic Centre – Map
- Changes in Modes of Travel in England Between 1985 and 2000- IELTS Writing Task 1 (Table)
- IELTS Academic Writing Task 1: Main Reasons why Agricultural Land Becomes Less Productive
- Cinema Viewing Figures for Films by Country, in Millions- Table
- Number of Medals Won by the Top Ten Countries in the London 2012 Olympic Games- Table
- IELTS Academic Writing Task 1 Topic 12: Internet use in six categories by age group – Table
- IELTS Academic Writing Task 1 Topic : Annual pay for doctors and other workers – Bar chart
- Division of Household Tasks by Gender in Great Britain- Bar Graph
- IELTS Academic Writing Task 1 Topic 11: Different methods of waste disposal in four cities – Bar Chart
- Amount of Leisure Time Enjoyed by Men and Women of Different Employment Statuses- Bar Chart
- Number of Computer and Internet users in Different Arab Countries- Bar Graph
- The Changes In Ownership Of Electrical Appliances And Amount Of Time Spent Doing Housework In Households – IELTS Writing Task 1
- IELTS Academic Writing Task 1 Topic : The Percentage of Female Members of Parliament in 5 European Countries
- IELTS Writing Task 1 – The graph below shows different sources of air pollutants in the UK Sample Answers
- IELTS Academic Writing Task 1 Topic: Price changes for fresh fruits and vegetables – Line Graph
- Demand for Electricity in England- Line Graph and Pie Chart
- Average Household Expenditures in a Country in 1950 and 2010- Pie Chart
- Methods of Transportation for People Traveling to a University – Pie Chart
- Percentage of Water Used for Different Purposes in Six Areas of the World- Pie Chart
- Online shopping sales for retail sectors in Canada – IELTS Writing Task 1 Pie chart
- IELTS Academic Writing Task 1 Topic 09 : Consequence of deforestation – FlowChart
- Academic IELTS Writing Task 1 Recycling process of wasted glass bottles Sample Answers
- Water Cycle Diagram – IELTS Academic Writing Task 1 Answers
- IELTS Writing Task 1 Process Chart 2024 – Process Diagram with Sample Answers
- Percentage of Food Budget the Average Family Spent on Restaurant Meals- Pie Chart + Line Graph
- Amount of Money Per Week Spent on Fast Food in Britain- Bar Graph + Line Graph
- Water use Worldwide and Water Consumption- Line Graph and Table
Frequently Asked Questions
What is the format of IELTS Writing Task 1?
How much time should I spend on IELTS Writing Task 1?
Do I need to include my opinion in IELTS Writing Task 1?
Should I include an introduction and conclusion in IELTS Writing Task 1?
How can I improve my vocabulary for describing visual data in Task 1?
Where can I find practice materials for Task 1?
What should I do if I don't understand the visual data in Task 1?
Should I include every detail from the visual data in my response?
Is there a specific paragraph structure I should follow in Task 1?
How can I practice for IELTS Writing Task 1?
Practice IELTS Writing Task 1 based on report types
Recent articles.

Courtney Miller

Kasturika Samanta

Janice Thompson

IELTSMaterial Master Program
1:1 Live Training with Band 9 Teachers
4.9 ( 3452 Reviews )
Our Offices
Gurgaon city scape, gurgaon bptp.
Step 1 of 3
Great going .
Get a free session from trainer
Have you taken test before?
Please select any option
Email test -->
Please enter Email ID
Mobile Band 9 trainer -->
Please enter phone number
Application
Please select any one
Already Registered?
Select a date
Please select a date
Select a time (IST Time Zone)
Please select a time
Mark Your Calendar: Free Session with Expert on
Which exam are you preparing?
Great Going!
Latest IELTS Writing Task 1 2024 (Graphs, Charts, Maps, Processes)
by Dave | Sample Answers | 147 Comments

These are the most recent/latest IELTS Writing Task 1 Task topics and questions starting in 2019, 2020, 2021, 2022, 2023, and continuing into 2024.
You can find all the most recent IELTS writing task 2s here and the general training questions here .
I also have recorded all the IELTS speaking questions here .
Learn here about how to write an IELTS general overview for task 1.
If you are able, please consider supporting my efforts (and receiving exclusive IELTS Ebooks!) by signing up for my Patreon here .
Enjoy and comment any questions/writing that you have!
Read my sample for the process below here.
Read my sample for the pie chart below here.

Read my sample answer for the map below here.

Read my sample answer for the Cambridge 19 line chart below here.

Read my sample for the line chart below here.
Read my sample answer for the chart below here.
Read my sample for the table below here.
Reported on IELTS November 27th
Read my sample for the bar chart below here.
Reported on IELTS November 5th

Read about the line chart below here.

Read about the pie charts below here.

Read about the chart below here.

Read about the bar chat below here.
Read about the map below here.
Read about map below here.
Read my essay for the bar chart below here.
Read my essay for the charts below here.

Read my essay for the line chart below here.

Read my essay for the table below here.

Read my essay for pie charts below here.

Read my essay for the process below here.
Read my essay for the map below here.

Read my essay here.

Read my essay or the process below here.

Read my sample answer for the bar chart below here.

Read my essay about this line chart here.
Read about this map here.

Read my essay for the bar chart and pie chart below here.

Read my essay for the combined pie chart and table below here.

Read my sample for the pie charts below here.

Read my sample for the chart below here.

Read my answer for the chart below here.

Read my answer here .

Read my sample answer for the table below here.

Read my sample answer for this process here.

Read my sample answer for this chart here.
Read my sample answer for the process below here.
Read my sample answer here.
Read my sample for this bar chart here.

Read my sample answer for this line chart here.

Read my sample answer for the floor plan below:

Read my sample answer for the new bar chart below here.

Read my sample answer for this table here.

Read my sample answer for this mine map below:

My Ebook for this (really difficult!) chart is only available on Patreon.

Read my sample answer for this question here.

Check with my sample answer here.

Read my sample answer for this (unusual) task 1 here.

Read my sample answer for this topic here.
The bar graph shows the total manufacturing production in percentages Asia, Europe, and the rest of the world.

| 10.3 | 11.6 | 13% | |
| 7.9 | 12.7 | 61% | |
| 6 | 5 | -17% | |
| 5.5 | 4 | -27% | |
| 2.3 | 5.1 | 122% | |
Read my sample answer for the floorplan below here.

| in 2009 | in 2010 | % Change | |
| France | 76 | 76 | 0 |
| USA | 66 | 67 | 1.5 |
| Spain | 55 | 56 | 1.8 |
| UK | 55 | 57 | 3.6 |
| Italy | 44 | 45 | 2.3 |
| Turkey | 32 | 46 | 33 |
| China | 22 | 34 | 55 |
| Germany | 10 | 24 | 109 |
| Hong Kong | 10 | 9 | -11 |

I want to make some simple suggestions for how you can use these recent graphs to practice.
To be honest, students get too obsessed with the most recent questions.
You can practice with a question from years ago and a question from yesterday – it makes absolutely no difference.
What makes an actual difference is how you study.
Here is what I recommend:
- Practice writing about a graph in 20 minutes, in test conditions.
- This is your ability. Now, check it by underlining the vocabulary, grammar, data. Are there many grammar mistakes? Do you use the same words over and over? Do you include all the data?
- Now that you know your weaknesses, you can also sign up to have them marked by me here .
- Write about another one focusing on your mistakes. Don’t worry about timing. Take as long as you need to make it perfect.
- Repeat this process over and over until your start to notice your writing improving.
Hope that works for everyone!
Recommended For You
Recent IELTS Writing Topics and Questions 2024
by Dave | Sample Answers | 342 Comments
Read here all the newest IELTS questions and topics from 2024 and previous years with sample answers/essays. Be sure to check out my ...
These are the most recent/latest IELTS Writing Task 1 Task topics and questions starting in 2019, 2020, 2021, 2022, 2023, and continuing into 2024. ...

Find my Newest IELTS Post Here – Updated Daily!
by Dave | IELTS FAQ | 18 Comments

Recent IELTS Speaking Topics and Questions 2024
by Dave | Model Answers | 74 Comments
These are IELTS speaking topics and questions in 2024 - if you want the current reported ones on IELTS, you can find them here. ...

New IELTS General Training Writing Topics and Questions 2024
by Dave | General Training | 93 Comments
Enjoy all the newest IELTS questions and topics from 2024 for the general training exam - as well as ones from past years that may come ...
Submit a Comment Cancel reply
You must be logged in to post a comment.
147 Comments

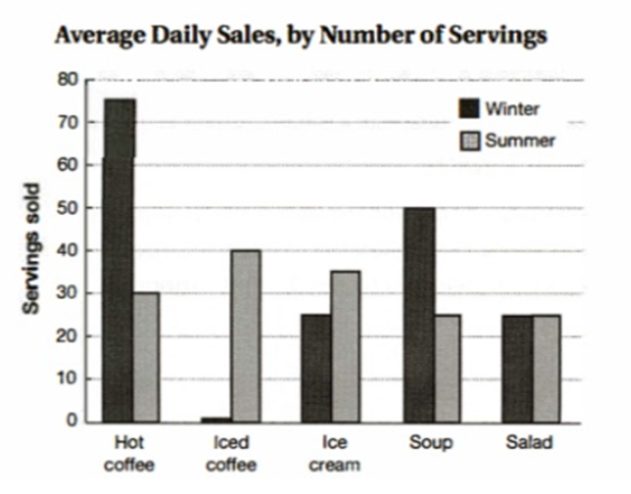
The bar graphs compare the rate of girls and boys between 5-14 years old who were engaged in cultural activites and sports in Australia in the year 2003. Overall, dancing was by far the most practiced activity among girls and the least for boys. Although practicing a sport was quite popular for both gender, it was noticeable higher for male children.
To begin, dancing was the most coveted spare activity for girls, a stunning 25% of them practicing it that year, whilst roughly 3% of boys did it. Playing a musical instrument, on the other hand, attracted a 15% and 10% of boys and girls, respectively, becoming the most popular for male children and adolescents. Drama and singing shared a similar rate, around 5% of all children were enganged in such programs, standing up as the least practiced, with the exception of dancing among boys.
With respect to sports, as expected, the proportion was by far higher for boys than for girls, 70% and 50%, respectively. In comparison with cultural activities, practicing sports definitively was the most predominat type of recreational activity among all children.

Great work! Your overview is clear enough for band 7+! Some small corrections ‘both genders, most common spare time, of boys participated, attrached 15%, being the most, being the least practiced, (take out the as expected bc it is too close to opinion)’
Merci beaucoup! I did not expect an answer, I just was practicing my ability to write a decent report in less than 20mnts. Thanks so much for your feedback, it is of great help. I’m using your site for self-preparation. Your explanations are clear, straightforward and appropriate. Hopefully, with your help (website, videos, blogs), I will hit my desired score. Great day! God bless you!
You’re welcome! What is your desired score? I can give you some more detailed feedback to help you get there…
I’m chasing a 7 in each skill.
You are close! Be careful with prepositions, make sure that your language isn’t too informal and small mistakes with grammar (infinitives, irregular past simple) might bring down your grammar score.
The given maps depict the changes that had taken place on a museum over a 60-year period, starting in 1957 to 2007. Overall, the museum grew in size and the majority of trees were removed in favor of that.
In 1957, there were a bunch of pine trees along the road and also on the museum’s surroundings. The museum facilities were made up just by a storeroom, a local history room and a national exhibition on the top center. Likewise, a straightforward path from the road leaded to the entrance hall.
By 2007, the museum witnessed several striking changes. Firstly, to built up a spacious car park, the path was bricked down and all the trees on the bottom (left-right) were cut down. Secondly, the building itself was enlarged on the north, and a completely new room was erected on the bottom left corner side, where the shop and main entrance were attached. With the exception of local history room , which was relocated on the center, the storeroom and national exhibition were eliminated. These changes allowed the introduction of a reception and cafe on the southern area, and a special exhibition and education center rooms on the north. Finally, the garden was the only element that remained untouched.
Good work again! Some corrections: The given maps depict the changes that took place in a museum over a 60-year period, starting in 1957 and ending in 2007. Overall, the museum grew in size allwoing for more customer focused shops and the majority of trees were removed.
In 1957, there was a grouping of pine trees along the road and also on the museum’s perimeter . The museum facilities were made up of just a storeroom, a local history room and a national exhibition on the top center. Likewise, a straightforward path from the road led to the entrance hall.
By 2007, the museum witnessed several striking changes. Firstly, to erect a spacious car park, the path was removed and all the trees on the bottom (left-right) were cut down. Secondly, the building itself was enlarged on the northern side , and a completely new room was erected in the bottom left corner, where the shop and main entrance are not located . Although the local history room was relocated to the center, the storeroom and national exhibition were eliminated. These changes allowed for the introduction of a reception and cafe on the southern area, and a special exhibition and education center rooms in the north. Finally, the garden was the only element that remained untouched.
Merci beaucoup monsieur! You’re right, after sending my draft I realized I had made quite a few grammar mistakes. To be honest, I always fight against preposition, specially those indicating “place”. I cannot identify when I need to use: IN, ON, TO when it comes to giving directions. As you can see: I used “on the north” instead “in the north” , or use the adjective “northern” without a noun. Please, suggest us a good grammar book to follow . Salut!
Sometimes prepositions are more like vocabulary than grammar. We always say ‘in’ not ‘on’ the north – just something to memorise! You can try this website: https://grammar.yourdictionary.com/parts-of-speech/prepositions/rules-for-prepositions.html
I also suggest keeping a list from my sample answers of the correct prepositions and using the list when you practice until you feel you have memorised them and no longer need the list. Good luck!
The given bar graph illustrates the levels of water in reservoirs in five Australia’s cities in 2009 and 2010. The data is measured in percentages.
Overall, the levels of water witnessed a significant decrease in city A, B and D, whilst city C and F showed a slight rise throughout the period.
In 2009, cities B, C, D and E shared a similar water levels around 70%. By contrast, city A stood out as that with the lowest levels at 50% and city F showed the highest ones at just above 80%.
With the exception of city E, which remained the same at 80%, all cities’ water reservoirs experienced changed by 2010. City C and F levels went up to just above 82% and approximately 99%, respectively. On the other hand, city D levels went down significantly from almost 70% to approximately 52%. The same occurred to city A and B, whose water rates dropped nearly 20%
Nice job again! The most important part is to be sure that you give some kind of overall ranking in terms of your overview as well.
Here are some small edits: “The given bar graph illustrates the levels of water in reservoirs in five of Australia’s cities in 2009 and 2010 in percentages . Overall, water levels witnessed a significant decrease in city A, B and D, whilst city C and F showed a slight rise throughout the period. City F had the highest water levels throughout while City A was consistently the lowest.
In 2009, cities B, C, D and E shared similar water levels at around 70%. By contrast, city A stood out as that with the lowest levels at 50% and city F showed the highest ones at just above 80%.
With the exception of city E, which remained the same at 80%, all cities’ water reservoirs experienced changes by 2010. City C and F levels went up to just above 82% and approximately 99%, respectively. On the other hand, city D levels went down significantly from almost 70% to approximately 52%. The same occurred to city A and B, whose water rates dropped nearly 20% a piece.
Thanks so much for your helpful feedback. I will soon sit the test, hopefully I will hit a high score.
I really hope you do well on it! Be sure to write me a message to let me know how it turned out!

The rendered bar graph illustrates the information about the organisation A-E those spent billions of euros on machinery , building,staff training and research section. One glance is enough to say that maximum euros was spent on staff training while the minimum euros was spent on research activity. It is evident from the graph that organization A was spent 1 billion euros on machinery . This value increased substantially at 16 billion euros by organization c then organization D and E invest less euros on machinery and it was reached at approximately 0.8 billion euros. Moreover ,on building had been spent 1.3 billion euros by organization A and there was non-noticeable decrease on building almost 1.4 billion erros by organization B . After that organization C,D and E had spent equal amount that is 1 billion euros on building area. Moving further, staff training was invested the highest amount that is 1.9 billion euros by organization B. There after , this value was declined by organization C ,D and E. However, organization B had invested nearly 1.6 billion euros on research section whereas , organization D and E was spent least amount on research area that is 0.7 billion euros.
Great work Navneet!
Some corrections:
The rendered bar graph illustrates information about organisations’ A-E spending in euros on machinery , building,staff training and research . One glance is enough to say that maximum euros was spent on staff training while the minimum euros was spent on research activity. (That phrase is too informal – better to say ‘Overall’, your overview must also touch on all areas and have a little more detail to get at least band 6 for task achievement.)
It is evident from the graph that organization A was spent 1 billion euros on machinery . This value increased substantially at 16 billion euros by organization c then organization D and E invest less euros on machinery and it was reached at approximately 0.8 billion euros. Moreover ,on building had been spent 1.3 billion euros by organization A and there was non-noticeable decrease on building almost 1.4 billion erros by organization B . After that organization C,D and E had spent equal amount that is 1 billion euros on building area. (This graph does not show increase or decrease over time. It just shows 1 time period so try to compare the data and forget about it going up or down.)
Moving further, staff training was invested the highest amount that is 1.9 billion euros by organization B. There after , this value was declined by organization C ,D and E. However, organization B had invested nearly 1.6 billion euros on research section whereas , organization D and E was spent least amount on research area that is 0.7 billion euros. (Good working describing most of the data but remember to compare for this type of graph, not show increase/decrease.)
Read more about graphs with no change over time here: https://howtodoielts.com/ielts-writing-task-1-analyse-tables-not-over-time/

Sir, can u check my sentence formation in this task because if i realize my mistakes then i will continue this….
The rendered bar garaph illustrates the information about the percentage of women age in Australia since they gave birth to their first child in 1966,1985and 2006. Overall,the maximum percentage of women was observed in younger age while ,the minimum percentage was calculated at older age in the whole period. It is vivid from the graph that 19 and under aged women gaved the birth of 33%of chlid in 1956 wheras, this percentage decreased to 25% and 18% in 1986 and 2006 respectively.
Overall,the maximum percentage of women observed were younger age while the minimum percentage was calculated at older ages over the whole period. It can be seen in the graph that… gave birth to…
Good start!
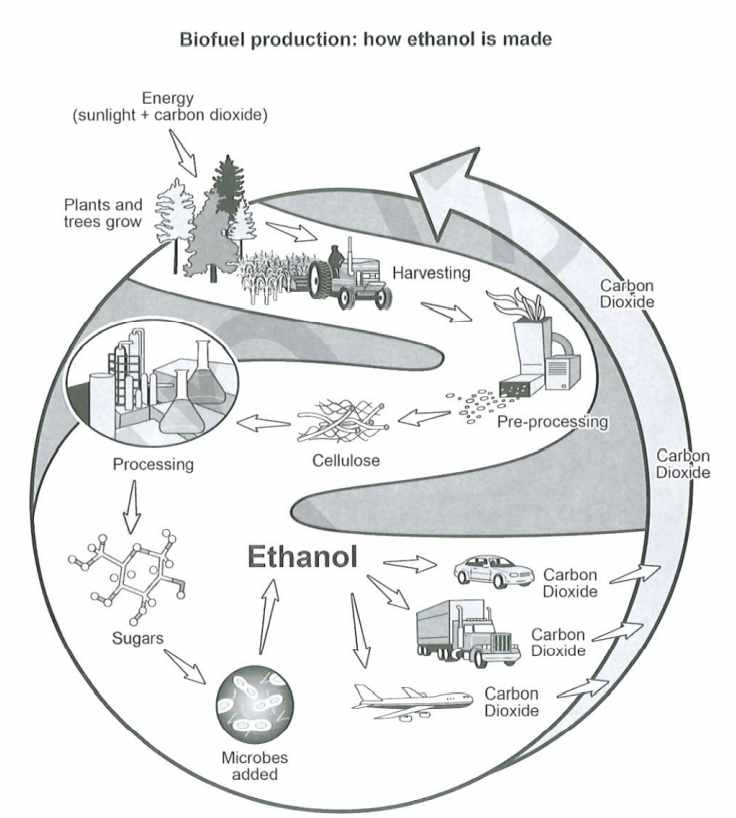
The given diagram illustrates the process, and its different steps, to produce ethanol fuel from raw corn. Overall, there are eight stages involved in the production of this renewable fuel, starting with corn storing and ending with its transportation to the public market.
First, the process initiate with having enough raw material (corn) for the ethanol production purpose. This corn is stored for a while, then it is milled profusely. Without delay, the milled corn is immediately mixed with water, to be then cooked it for exactly four hours. Shortly after, it is kept sealed in containers for up to 48 hours, allowing it ferments sufficiently.
Once the fermetation have finished, the liquid and the solid by-product are neatly separated, and the former undergone a purified procedure for five long hours. The ending product is purified ethanol, which is stored for an undefined time. Finally, the ethanol fuel is ready to be transported to its different destinations.
Good work again! Some correctins: ‘The given diagram illustrates the process, and its different steps, to produce ethanol fuel from raw corn. Overall, there are eight stages involved in the production of this renewable fuel (don’t need to include the number of steps in your overview), starting with corn storage and ending with its transportation to the public market.
First, the process initiates with having enough raw material (corn) for the ethanol production. This corn is stored for a while then it is milled before being mixed with water, to be then cooked it for exactly four hours. Shortly after, it is kept sealed in containers for up to 48 hours, allowing it ferments sufficiently.
Once the fermetation has finished, the liquid and the solid by-product are neatly separated and the former undergoes a purified procedure for five long hours. The ending product is purified ethanol, which is stored for an undefined amount of time. Finally, the ethanol fuel is ready to be transported to its different destinations.
A couple things: stay away from opinion/speculation like profusely, immediately, etc.
For your overview, try to group and define the stages – don’t need to say the number of stages.

The graph illustrates the percentage of women in different age groups in years 1966, 1986 and 2006. The first age group of 19 and under was the highest in year 1966 at 35% and the lowest in year 2006 at 15%. In year 1966, the percentage of women who were 20-24 years old was 60%, which is more than both in 1986 and 2006. The age group of 25-30 years was 50% in 1986 and it was higher than both 1966 and 2006. The percentage of women in the age of 30-34 years has been increasing steadily since 1966. It was 15% in 1966, 20% in 1986 and 45% in 2006. Its rise is opposite to 20-24 age group, which declined between 1966 and 2006. Another age group that has been on the rise is the 34-39 years, as it was 5% in 1966, 15% in 1986 and 30% in 2006. Both age groups of age 30-34 and 34-39 have grown in percentage between 1966 and 2006. The last group of women aged 40 and above has remained the lowest among all the age groups.
Well done! Some corrections:
Your grammar is very accurage but it is a little mechanical because you don’t compare and most importantly there is no general overview so your maximum score is band 5 for task achievement even though all the data is accurate!
https://howtodoielts.com/ielts-writing-task1-band-7-overview/

Hi Dave, thank you so much for your feedback man!! I gave the test and got a 7 on written, and 8 overall. thank you so much for you help 🙂 have a great year ahead!! lovepreet
Thanks for letting my know – congrats on your score!

The given bar graphs depict the proportion of 5-14 males and females’ age group joined the cultural activities and sport in Australia in the year 2003. Overall, it is clear that most boys were more athletic and played a musical instrument, while girls were fond of dancing than boys. Boys were more attracted to a sporting event, at 70%, while the figure for girls who participate was just above 50%. However, when it comes to cultural activities, female dancers recorded the highest percentage in the graph at 25%, compared to a marginal number of males at just 3%. Almost identical figures for both genders can be seen in singing and drama with only 5% of them participated in these categories. Playing a musical instrument is the category that the same genders had the interest to do. Most participants came from a group of boys at 15%, compared to just 10% for girls.
Thanks for commenting!
Here are some corrections:
The given bar graphs depict the proportion of 5-14 males and females’ age group joining cultural activities and sport in Australia in the year 2003. Overall, it is clear that most boys were more athletic and played a musical instrument, while girls were fond of dancing than boys. Boys were more attracted to a sporting events, at 70%, while the figure for girls who participated was just above 50%. However, when it comes to cultural activities, female dancers recorded the highest percentage in the graph at 25%, compared to a marginal number of males at just 3%. Almost identical figures for both genders can be seen in singing and drama with only 5% of them participated in these categories. Playing a musical instrument is a category that interested both genders. Most participants came from a group of boys at 15%, compared to just 10% for girls.
Good work! Did you mention all areas on the graphs in your overview?
Yes, I mentioned it all. Sorry, this is my first time practicing a timed task. What would be my possible score if you will base in my answer? Thanks!
Your score is in the band 6.5/7 range in terms of language ability. What score are you going for on the exam?
My target is above 6.5 in writing. Hoping that I can achieve that band score. Thank you!
Keep up the hard work!
The diagram reveals the way of producing ethanol fuel from corn. Overall, it is clear that there are eight stages in the process, beginning with the corn harvest, fermentation and transition of corn into a liquid, to the transportation of the product made.
In the first stage of making purified ethanol is storing the corn before it undergoes milling. The milled corn is then added by water and cooked for 4 hours. After that stage, corn will be fermented for 48 hours. Separation of solid to liquid is the next step. While the solid by-product is not needed after the transition process, the melted corn is then kept.
In the subsequent stage, the melted corn product goes through a purification process. This process takes 5 hours to be able to produce purified ethanol. Storing of the made ethanol fuel product is the next step. Finally, ethanol fuel is transported to its destination.
Good overview Jessica!
Really good accuracy with your passive verbs – you are well within your target band scores range!
Thank you so much! Im a bit confused if what kind of tense should I use in diagram task?
For a diagram it should be mainly in the present and present passive, maybe some present perfect!

The bar graph give information on percentage of water level in reservoirs in six different Australian cities in October 2019 and 2010. Overall, the greatest water level always was in city B and city F and increased , moderate for for city B and city D where decreased and for city E, where remainded the same, while the lowest for city A where decreased over the year. Water level in city F and city C in 2009 was at 90% and 80% respectively and grew for both by 10% in 2010. On the second position in case of resevoired water in 2009 was city B and city D with the figure of 80% which diminished to 65% and 50% respectively in 2010. Although water level of city E was similar in 2009 to those of in city B and city D, it remained on the same level in 2010. The modest water level was in city A. For this city we can spot a drop from 60% in 2009 to 45% in 2010.
Well written, Iza!
Be careful with helping verbs. You don’t need to say ‘was increased’ just ‘increased’
Good work describing the full trend for your overview!
You need clearer paragraphs though – take a look here to see some examples: https://howtodoielts.com/category/writing-task-1/academic/
Keep working hard!

Hii Dave.. I really want your possible score on this writing task 1..
Hi Saini/Iza, this essay is in the band 5 range at the moment.

But do you think it deserves 7 band?
The given bar graph illustrates that in the year 2003,the proportion of Australian boys and girls aged 5-14 participates in cultural as well as sports activity.. Overview the dancing activity was most favorable cultural activity shown by girls in comparison to boys.. The boys preferred more sports, although it was quite popular in both the gender…. To begin with, it can be clearly seen that, the percentage showed big difference in dancing activity, which was 25% girls participate in it, whereas there was less than 5% boys in same activity.. By contrast, the proportion of boys were 70% in sport which was highest rates… Probing further, the drama as well as singing activity received the similar percentage 5% by both the gender in the year 2003, respectively.. Moreover, in the play musical instrument ,one in ten girls participated which was 5% inclined by boys in the Australian… Thanks.. Dave I really want your response on this
Good work Saini!
Try copying some expressions from my sample answers more closely such as ‘Overall,’ instead of ‘overview.’
Don’t use … – that is too informal. Just use a period.
You are experimenting with a lot of new grammar and vocabulary which is good but you need to focus more on accuracy as it is quite hard to understand at times. Keep it up!

Thank you for your response.. What score I can get according to you on this task 1
This answer is i nthe band 5 range at the moment.
The table shows the details of five different kinds of vehicles registered in Australia in the years 2010, 2012 and 2014. Overall, it is clear that all types of vehicles increased in percentile over the given period in which the percentage for motorcycles had jumped most. It could be noticed also that passenger vehicles got the highest numbers while light trucks were the lowest.
A glance at the graph reveals passenger vehicles started from 11,800,000 units in 2010, rose almost a million over 2 years, then climbed to 13,000,000 in 2014, accounting for 10.2% over the period. Similarly, commercial vehicles uplifted to 17.4% from 2010 to 2014. In the first year, 2,300,000 were recorded, increased to 2,600,000 in 2012, before reaching 2,700,000 in 2014.
A most striking positive change can be seen in the proportion of motorcycles which is 30.8%. It started from 540,000 registered motorcycles in 2010 then rose dramatically to 680,000 and 709,000 in 2012 and 2014 respectively. Meanwhile, an almost identical positive trend can be seen in the numbers of heavy and light trucks. A marginal upward movement from 384,000 to 416,000 at 8.3% over 4 years for heavy trucks can be considered while a significant escalation at 23.5% is remarkable in the number of light trucks.
given period and the, motorcycles jumped the most, it can also be seen that, had the, commercial vehices grew to, increating to 2,600,000, can be observed while
Keep it up!

The bar chart provides data on the water levels of reservoirs in six Australian cities from 2009 to 2010. Overall, city F recorded the overall highest levels, closely followed by city C and E, while the percentages of city A were the lowest in both Octobers. some cities, such as F and C recorded higher water levels in 2010 compared to 2009, whereas the remaining cities showed a reversed pattern except city E with both numbers leveling up.
Looking in more details, city F stood at 90 per cent in Oct, 2009 and climbed to nearly 100% in 2010, which was the highest among all. Likewise, city C experienced a considerable growth from just over 80 per cent to approximately 91% in the next year. In contrast, city B and D showed a decline in water levels, from identically 80% to around 62% and 50% respectively. Figures of city A also dropped considerably from 60% to about 45% by 2010. The water level of city E was just above four fifths in 2009, and this number remained unchanged in the following year. (180 words)
Really nice writing again, Jing!

The chart presents data on the percentages of Australian children aged between 5 to 14 who join cultural activities and sports in 2003. Overall, sport was way more popular than cultural activities for both genders, while boys were more active than girls. A Lot less children participated cultural activities though the number of girls who danced stood out. Except for those who play musical instrument, the remaining culture activities only attracted a minimal amount of children. Looking in more details, over half of female students joined sports, however the percentage of active boys was even higher at as much as 70%. Likewise, there were more boys who played musical instrument than girls, at 25% and 10% respectively. In contrast, Dancing was substantially more popular within girls, attracting a quarter of females compared to merely approximately 3% of males. Besides, both boys and girls showed least interest in drama and singing with only 5% in turn of either gender group did those activities. (162 words)
Good work Jing!
Be careful with your tenses, prepositions and fixed expresssions: Looking in more detail…

The line chart compares the priced of fresh fruits and vegetable, sugar and sweets as well as carbonated drink from 1979 to 2009. Overall, even though all categories started off at broadly identical prices, the growth in fresh fruits and vegetables overweighed consumer-price index by a massive margin, while the rest displayed a much slower upward trend. Looking in more details, sugar and sweets closely following consumer-price index, showed a slow yet steady growth throughout the thirty-year period. The price of soft drinks, however, remained stable after a surge in 1984 at around 115 until 1999, when the price rose again slowly. In contrast, there was a substantial growth in the price of fresh fruits and vegetables over the given period, which, despite a dip to about 90 in 1984 and some fluctuations, rose significantly from just above 50 in 1979 to nearly 350 by 2009. In fact, the price only levelled out temporarily between 1990 and 1992 and again from 2000 to 2001. (164 words)
drinks, outweiged, followed, showing, inclue more data in the second paragraph!, levelled off

The line graph provides information on the number of middle-aged citizens in three countries over a 50-year period between 1950 to 2000. Looking from an overall perspective, this particular age group had grown at a broadly comparable pace in China and India, with Chinese midyear crowd continuously outnumbering that of the India’s, while the midyear population in USA also increased, but by a comparatively small margin over the years. Looking in more details, Chinese mid-aged population started off the highest among three countries at just below 600 million in 1950, which outnumbered that of India by about 200 million, and USA by 400 million. Despite a short period of stability at approximately 620 million from 1960 to 1965, the number of China surged as rapidly as India’s. By the end of the period, the figures of China and India had reached 1200 million and 1000 million respectively. The increase of the US mid-agers, on the other hand, was relatively gentle. By 2000, the number of USA had risen slightly to only about 280 million, which was almost lower than the leading country’s by 1000 million. (185 words)
You tend to overuse past perfect when you could just use past simple: grew
You use it correctly in your last sentence though!
Smaller margin, among the, numbers for China, US middle-aged residents

dear admin i would like to express my great appreciation for your hard work in collecting and answering all these samples, good job! i found your sample answers highly useful as well as being professional. please proceed with your work in assembling the latest task 1 questions.
Thanks so much, Homa – I really appreciate that!
I wish I could publish the task 1 essays as regularly but it is much harder for students to remember the graphs from the exam.
But I will continue to publish any task 1s that I get reports on!

Thank you very much for your efforts and your time to help all the students who are preparing themselves for the IELTS. I do really appreciate that. I’ve just started preparing myself for the IELTS exam and this is my first writing attempt.
The graphs illustrate the rate of boys and girls who participated in organized sports and cultural activities aged 5-14 in 2003 in Australia.
Overall, girls participation showed an upward trend in the cultural activities,while boys showed a dwonward in many activities. Both boys and girls participation experienced some fluctuations in both activities, although boys had initially a lower participation percentage, but they outraced girls in the end.
Boys rate was less than 5 percent in drama activities which was so close to girls rate, then it kept decreasing to almost 3 percent in Dancing activities which is the lowest rate of all activities. the rate showed a gradual increase in singing activities by approximately 2 percent, and it showed a significant raise to 15 percent in playing musical instrument. Eventually boys outraced girls in sports activities hitting a high-point of 70 percent, which is the highest perentage of all the period.
percentage of girls who participated in drama was as low as the percentage of girls who participated in singing activities, then the rate showed a significant increase of 25 percent in dancing activities, it decreased by 15 percent in play musical instrument. and it kept increasing to almost 52 percent in sports activities which is the highest percentage of all acitivities.
Thanks for saying that Madjid!
Careful of some informal words like outraced and try to be a little more accurate: significant rise, musical instruments, which was, etc.
Some simple mistakes but a great first effort!
Your overview is good too – keep working hard!
The bar graph compares the proportion of people living in households in the UK between 1981 and 2001. Overall, it is clear that households consisting of more people deteriorated while homes with fewer persons increased. The percentages for the two middle groups oppositely changed by the same margin.
A glance at the graph reveals that proportions for 1 and 2 people households both escalated by 3%, at 26% and 36% in 2001 respectively. These figures were the highest over the given period. An identical trend can be seen in the percentage of 4 people houses, it jumped from 12% to 15%.
On the other hand, the proportion of houses with 6 or more people plummeted from 6% to 2%, and 5-people homes percentage just dropped a quarter, from 8% to 6%. These two figures with the lowest percentages in 1981 remained at their place in 2001. Similarly, the figure for 3 people houses also fell by 3% over 20 years.
Well written Jessica!
‘Deteriorated’ has a negative connotation so I wouldn’t use that word.
Really nice linking and comparison in your writing!
The diagram illustrates the filtration process of drinking water in a single town in Australia. Overall, there are four main stages as is presented above, beginning with the rainwater collection, water filtration and treatment, to the distribution of drinking water to households. The entire process is controlled by the plumbing system.
In the first stage, rainwater is collected through roof gutters and downspouts of townhouses. The gathered water undergoes filtration through the pipe before being deposited in the storage tank.
In the subsequent stage, water from the storage tank then transferred by a pipe to the water treatment tank. At this stage, the removal of contaminants is being done by placing chemicals in the water treatment tank. After the purification process, the potable water is then finally distributed to townhouses. And, the treated water is regulated by faucets in every household and is now safe to drink.
Well written!
Really nice overview – it should be band 7+ for task achievement.
Careful with your singular/plural – through the pipes.
And your helping verbs: is then transferred…
The maps illustrate the development of a museum between 1957 and 2007. Looking from the overall perspective, it is clear that significant changes had been made over the period. The most noticeable improvements were the size of the building which had been expanded and a car park which was created.
In 1957, there was a pathway from the main road to the museum. The entire building of the museum had only four parts, beginning with the entrance hall, local history room, museum store-room, and the national history exhibition. The garden was located in the northwest. Also, several trees were planted along the road and surrounding the building.
Over 50 years, a major transformation could be seen on the map. The pathway connecting the road and the museum was demolished, and trees in front of the building were cleared to make way for a car park. A number of trees circling the museum also removed for its expansion. Rooms in the building had been removed except for the local history room. Cafe, museum shop, reception, special exhibitions, and education center section were added. However, the garden in the northwest remains unchanged.
Good job Jessica!
from an overall… were made… which was expanded
Careful confusing past perfect, present perfect and past simple in your answers!

The Chat Represent the survey regarding people’s coffee and tea buying and drinking habits in five Australian cities.
The bar chart shows drinking habits in 5 Australian cities as a relate to coffee and tea on the last 4 weeks .Overall,the half population in all cities except Adelaide went to a cafe for coffee or tea, while buying coffee was also popular and buying fresh coffee generally less normal.
See, first of all at going to cafes,it was more merits of Melbourne and Hobart at 64% and after that 63%.Sydney was comparably high over 60%, followed by Brisbane at over 55%, and Adelaide at under 50%.Further more the Hobart, instant coffee purchases at 54%, Brisbane at 52%, Melbourne at 48% and lastly Sydney just over 45%.
So, the last i sum up according to all information,fresh coffee was below 45% for all cities and basically Sydney 44% and Melbourne 42%, Hobart was next at 39%,Adelaide and Brisbane were much lower ratio produced .
Good Nisha!
as they relate to… over the last … less common … Looking first of all at cafes… higher at over… Furthermore… at just over
Good but be careful with your accuracy!

The table illustrates the percentage of tourist visited in 9 countries between 2009 and 2010. Overall, it can be seen that the amount of visitors visit in France and USA stand out the most in both years and both Hong Kong and Germany are more than 100 percent.
According to the data the number of visitors in France remain the same by 76% while both USA and Spain has a slightly change by less than 2 percent. As for UK and Italy has a small change by less than 4 percent in both years.
However, both Turkey and China has a considerable change by less than 60 percent but more than 30 percent which cause them to rank the sixth and seventh out of nine countries. While, Germany has a huge change by more than 109 percent of visitors but Hong Kong was the lowest visitors by 10 percent in 2009 and in 2010 it
Great work Jane!
You should mention all categories in the overview (at least partially) to get above band 5 for TA.
Careful with your tense!

The pie chart below reveals the types of works do Anthropology graduates did after finishing their undergraduate course and the table records the salaries of Anthropology graduates for 5 years of work. It can be seen that most graduate students work as a full time and follow by part time workers unemployed full time postgrad study not known workers and part time with postgrad studies. Also the average of salaries of Freelance consultants is much higher than Government sector and Private companies.
Most graduate students were working as full time workers by more than half percent, follow by part time workers by 1\5 of the students and for the unemployed are less than a quarter just 12%. While, both full-time postgrad study and unknown workers have 8% of students. As for students occupation as past time with postgrad study has 5% of them.
However we can see that from $25000-49999 and $50000-74999 private company pay scale was the highest by 10% and 35%. While, government sector pay scale was the highest with the amount of $100000+ by 50%.
Another good one Jane – a really tricky one to do the overview for so I wouldn’t worry too much about this one.
Be careful with plurals, tense, and subordinate clauses/linking words.
The graph below illustrates the number of tourists visiting Caribbean island as well for visitors staying on cruise ships staying on island and total number of visitors between 2010 and 2017. Overall, it can be seen that total visitors rose considerably follow by visitors staying on island and overtaken visitors staying on cruise ships.
Visitors staying on island remained the same from 210 to 2011 by 1.75 millions of visitors and it rose particularly in 2011 to 2013 and it remained the same for the next 2 years by 1.5 millions of visitors. It fluctuated between 2015 and 2017 by 1.5 millions of visitors. While number of visitors staying on cruise ships fluctuated between 2010 and 2013 by 0.25 to 0.5 million visitors. Then, it rose considerably for the next 5 years and reached its peak by 2 million visitors.
However, the number of total visitors from 2010 until 2015 rose significantly and it had not change in 2015 and 2016 but it reach it peaked by 3.5 million visitors by 2017.
Keep up the hard work with all these graphs, Jane!
Good overview for this one and better accuracy with your tense and grammar.

You’re welcome!

The graphs below illustrate the proportion of people who are smoker and consumer of alcohol in the USA, JAPAN, TURKEY and HOLLAND from 1960 to 2000. Overall, it can be seen, USA people had a substantial percentage in smoker and utilizing of alcohol during the specific years. At first graph, the USA in 1960 60 percent of people were smoker and this amount had remained unchanged until 1970 whereas, in 1980 its number had noticeably declined to 46 percent and finally this flow stayed at 40% in 2000. Also, in JAPAN we are witnessed gradual decrease around 10 percent from 1960 to 2000 which same as the USA had stopped at 40%. On the other side, in the second graph, there is a wide difference in TURKEY and two other countries. In HOLLAND in 1960 per person only drank 4 litres and this number had remarkably soared to 11 litres in 1980 and to 2000 had a slight drop to 11 litres. By contrast, in TURKEY at 1960 per person had consumed only1 litre and this line moved upward to 2 litres in 2000.
Great Mahsid!
There is some informality in your writing but otherwise easy to follow!

Thanks Dave for the study material.
You’re very welcome!

sorry, are these below corrections done for free?
The comments I post below are free, yes, Sima.
I don’t always have time to give detailed feedback.
You can consider the paid ones here: course.howtodoielts.com/band-scores-corrections

The pie chart above details the usage of water in Australia in 2004 by various sectors, while the bar chart expands on the residential use of water as it is apparent to be the highest compared to rest of the variables. Generally looking, residential houses took more than the half of the pie, this is followed with Industrial, residential apartments and business which are almost sharing similar percentages. On the other hand, the bar chart shows the peak in the bathroom figure and the most decline in the kitchen’s one. To further analyze this into details, the pie chart presents residential houses as the major consumer of water by approximately 60%. Residential apartments come next by almost a quarter (20%). Business and the Industrial groups both have similar portions of the pie by almost 15% each. Water is less used in the Governmental sector by 10%, while other unidentified usage channels take less than 5%. The bar chart dives deeper into residential usage of water. Bathrooms took more than a quarter (26%), while gardens are almost 24%. This is followed by washing cloths 20%, toilets 15% and finally the kitchen 10%.
Sorry for the late reply Aala, I think your essay is strong overall and you describe the data well. Be careful with your special and punctuation though!
hello Mr. Dave, can check my essay on task 1, the last thing uploaded in the comments, I really need your feedback
I’ll try to get around to it tomorrow, Aala!
The pie chart above details the usage of water in Australia in 2004 by various sectors, while the bar chart expands on the residential use of water as it is apparent to be the highest compared to rest of the variables. Generally looking, residential houses took more than half of the pie, this is followed with Industrial, residential apartments and business which are almost sharing similar percentages. On the other hand, the bar chart shows the peak in the bathroom figure and the most decline in the kitchen’s one. To further analyze this into details, the pie chart presents residential houses as the major consumer of water by approximately 60%. Residential apartments come next by almost a quarter (20%). Business and the Industrial groups both have similar portions of the pie by almost 15% each. Water is less used in the Governmental sector by 10%, while other unidentified usage channels took less than 5%. The bar chart dives deeper into the residential usage of water. Bathrooms took slightly less than a third (26%), while gardens are even less by 24%. This is followed with washing cloths 20%, toilets 15% and finally the kitchen 10% only.
Replied on the one above Aala! You can also check here: course.howtodoielts.com/band-scores-corrections

Very good orginized
Thanks, Shakha!

Given are two maps of an unnamed cinema illustrating changes that have been done from 1980 till now. A glance at the figures provided reveals that the number of cinema halls upgraded from two to five being able to screen five different movies simultaneously; also noteworthy is the fact that on the lower-left corner of this place, which used to be a hall number1, a relax room and buffet which star to serve food as well as drinks, are constructed. In the place of the buffet of 1980, in which only drinks could be found, a DVD shop is opened. One particularly interesting fact highlighted by the figure is that in 1980, the cinema was associated with a car park, which is now replaced with two other cinemas. The only similarities that can be found are the places of male and female toilets as well as ticket shop which remains on the right side of the main entrance. Looking from an overall prospect, besides the increased number of cinema halls, not only a relax room and DVD shop are added but also an option of purchasing food as well as drinks are provided.
Well written! That have taken place since – don’t use glance because it is too informal.
The overview is also a bit too specific and careful with tense.

The diagram explains the modification of cinema according to the time from 1980 till date. From an overall perspective, it can be readily apparent that the same area has been customized with a variety of services than before.
Two cinema halls are replaced with five and the car park has been completely removed from the area. Back in 1980, the right side of the entrance was occupied with cinema 1, whereas it has been replaced with food and drinks and relax room. Similarly, on the left-hand side of the entrance, drinks have been replaced with a DVD shop while the ticket counter is at a previous place.
Moving forward from the entrance, on the right-hand side, there used to be a toilet; now toilet occupies the area between cinema 1 and cinema 2. On the opposite side, cinema 3,4,5 can be seen now, replacing cinema 2 previously.
Nice writing, Sushma!
There are a lot of mistakes with fixed expressions though so try to study my sample answers more closely and use the same phrases.
The overview needs work or you will be limited to a 5 for TA!

Can someone please mark the mistakes and evaluate the IELTS BANDS for me?
The given diagram illustrates the changes of a cinema from 1980 until now.
Overall, The cinema complex changes a lot throughout time, if we take the basic changes such as the number of theaters and different conveniences such as a Relax room and a DVD shop.
In the terms of cinema theaters right now in the complex, there are 5 theaters rather than 2 in 1980, during the time our world becoming more modern and especially digital so, that’s why there is a DVD shop where you rent and buy the latest movies and daily shows. And for the conveniences now there is a Relax room where you can enjoy and spent time.
But, there is the same thing which is still the same such as the number and position of toilet and ticket counter. There are some more changes but those changes are not that big such as position and list of the menu of the restaurant now it’s on the right side and now you can buy food also, And there is something which is missing now like car parking, Overall the feeling is still the same when we visit the cinema complex
Hi Sifar, you can find out your band score here: course.howtodoielts.com/band-scores-corrections
What score are you aiming for?

Australian water consumption in different sectors and the percentage of its usage in apartments or houses in 2004 are depicted in the pie chart and the graph. In general, it is salient that most of the utilisation of water was from residential sector.
To begin, the proportion of water consumption was relatively unbalanced. This is because the biggest contributor for water consumption in Australia was home owner with more than half of the total chart. Then, it was followed by apartments owner and business which had a similar proportion. Moreover, industry and goverment took the fourth and fifth place, consecutively. Lastly, with the least contributor of the chart was other.
Furthermore, the high percentage of residential water consumption in 2004 was specified into its bathroom, toilet, washing clothes, kitchen, and garden usage. Bathroom came in the first place with around 27%, which then followed by garden with a slight gap of approximately 2%. The third place belonged to washing fabrics which had about 20%. The utilisation of toilet was at 15%, which was 5% higher than kitchen.
Dear Dave, I hope you can give me some feedback on Task 1. Thank you in advance!
Nice effort, Rifqu!
You need to cover all areas in your overview or it is an automatic band 5 for TA!
The rest of the details are good though there could be more data. Keep working hard!

The diagram below illustrates the changes cinema has undergone starting from 1980 to the present. Overall cinema center has modified such that there are more number of cinema screens and scope to eat and relax increased at the expense of car parking. Figure of cinema screens has increased from two to five. car parking was removed and that place was used to accommodate cinema screens two and three,whereas cinema screen two was further divided into two different screens four and five.cinema one was moved beside to toilet and that place was used to construct relaxation room and foods and drink store. Places which has retained their positions are toilet,ticket center and entrance,Parking was totally eliminated.In place of drinks, DVD shop was developed
Good effort, Madhuri!
Careful of opinion words like ‘relax’ and work on your grammar!

The given diagram compares the changes in cinema structure from 1980 till present. Overall, It can be seen that, the number of cinema hall significantly increased over time.Also,recreational room and DVD shop were installed whereas car parking was completely removed as a part of redevelopment. With regards to cinema hall, three new theaters were added thus making the count to increase from two in 1980 to five in present day.Moreover, car parking which took majority of space in 1980, was demolished later and readjustment of theaters were made in the available space. In addition to cinema halls, recreational room and DVD shop were also introduced for people visiting theaters in current day as opposed to no relaxation room and DVD shop back in 1980.Additionally,Foods were also included along with drinks.
Nice writing Poonam!
Careful with your punctuation though!

The two Theatrical plans depict outlay of 1980 and current times , indicating that cinema outlets have become more than double and shops diversified with toilet remaining the same and parking zone disappearing altogether . In 1980 every corner was occupied with cinema houses , servicing shops and a toilet ,whereas current times show the optimum utilization of spaces. While cinema houses have grown over the double , ,so have the variety of myriad servicing shops too have extended . The new shops erected on displaced theatres are now catering to variety of novel uses of entertainment to the viewers who can enjoy variety of snacks , relaxation and entertainment under one roof . Toilets and Parking zone have either remained the same or have been wiped out altogether . Earlier one zone which was allocated for car parking has now totally disappeared . Similarly the toilets too have remained unchanged over the time .
Nice work, Swati!
Only capitilise proper nouns and be careful with your adjectives.
The given map represents the current and proposed plan of a civic center of the 23/1 Mainland China. Overall, It can be seen that although the layout of the civic center has no change in the future, there has been quite significant modification in the area blocks. The North of the current plan contains two blocks for car parking at the ends of the North Avenue which is proposed to be replaced by a cafe in the top left corner and hostel and restaurant in the top right corner. The cinema which is present in between the car parking is planned not to be changed. Moreover, the IELTS speaking and writing corner in the center of the area is expected to be completely removed in the future. Moving towards the South of the proposed plan, the council offices have been shifted to the corner facing the High Street which was is in between the exhibition center and town hall. Next to the council offices, an underground library is an addition to the civic center. Additionally, an underground car parking is also expected along with the town hall. Although the shopping center is expected to remain unchanged, the library is supposed to be replaced by an exhibition center in the bottom right corner next to the Smith Street.
Nice writing Poonam – sorry about the watermark – that’s not part of the map…
Nice writing otherwise though be careful with your definite articles!

The bar chart illustrates the proportion of older people residing in Canada, Germany, and the UK during 1980 to 2030.
Overall, we can deduce that there is a gradual rise in the ratio of elderly individuals staying in these three countries.
In 1980, we can see that there was a slight difference of around 1% between the UK and Germany in terms of elderly residents of these countries. While, Canadian elderly consisted only 10% of the total population in that year. Whereas, in the year 2000, there was a marked increase of 20%, which could be seen in the percentage of elderly native of Germany compared to the equal percentile of the rest two countries that was 15%. In contrast, in the year 2030 Canadian elders made more percentage than the UK elderly by roughly 2% of the total, but Germany still remained the highest one among the other 2 countries in all the 50 years that was 25% of the total percentage.
Nice writing again, Archana.
Your overview needs a bit more detail as well – did any of the countries overtake the others?
We also don’t use ‘whereas’ to start a sentence.
The process chart describes the ways by which cocoa products are manufactured for the commercial use. Overall, there are three steps in this process from collecting to dispensing the products.
During the initial stage, cocoa beans are collected by the worker from the cocoa field as a whole bean covered with shells. Then, these entire beans with shells are dried before sending it for pressing and draining the cocoa liquor. Afterwards, some cocoa liquor is passed on to the further pressing to get the components for the preparation of cocoa cake and cocoa, rest cocoa liquid is transferred to the industries for the refining purpose for making chocolates by adding sugar and cocoa.
Then, these cocoa cakes are grinding to make cocoa powder and industrial cake drinks. Also, industrial chocolate, which was made in the subsequent step is refined further and processed before releasing it for the commercial purpose and finally, these products like cocoa powder, cake drinks and chocolates reach the market.
Good, but try to define the stages a bit more in your overview, Archana, otherwise you’ll be stuck at band 5 for task achievement.
Good use of linking words!

The two diagrams provide information on how the design plan of Mainland China’s Civic centre will undergo a change from now to coming days.
Overall In future new coffee shop, commercial building and food shops will be introduced in the place of parking lots in the side of North Avenue while the Victoria Avenue side will be more or less same with relocation of council office, library and exhibition centre between the High street and Smith street.
As the time passes the movie theater and markets will be in the same place with no change at all. The parking areas will be shifted underground from North Avenue towards Victoria Avenue on which the town hall will stand like before. There will be an interchange of places among the council office, library and exhibition centre.
The council office has tend to move just beside the High street with a new larger library built beneath the ground level along side. Unlike the library the Exhibition gallery will be smaller in size in the coming days and will replace the present library behind the malls just at the edge of Smith street.
Great work, Mafruha!
Where did you get that map from by the way?
Careful with words like ‘tend’.
Thankyou I just took a screen shot

The map represents the layout of a museum in 1957 and 2007 . It can be clearly seen in a glance ; there where significant changes made to by 2007 in comparison to 1957.
The museum initially was centered around a garden. In 1957, the national history exhibition was a long room ,the entrance from the road directed to the national history exhibition . The local history room and museum store room where on the either sides of the entrance hall. The museum was parallel to the road .
In the year 2007,the museum has been expanded . In addition to other amenities . The national history exhibition is replaced with the local history room , in the top left corner is special exhibition and on the top right is the education center . The local history in 1957 was replaced with the reception in 2007 and the museum store room was replaced with a cafe.The entrance is relocated to an adjacent room that is newly constructed which is a museum shop.
From an overall perspective, it is readily apparent that there are some radical changes that took place over half a century from 1957 and 2007
Great work Lois!
You need to group and define your changes for the overview to be above band 5 though!

The Picture illustrates various changes till now from year 1980 in Cinema. Overall, numerous cinemas have been built within the region. Alongside, new rooms and shops have been set up with removal of car parking in the North . From year 1980 to year 2020, new cinemas have been constructed within the premises, with only 2 cinemas in first year to total of 5 cinemas in the current year. The car parking has been permanently removed and it is now replaced by two cinemas numbered 2 and 3, one of which is relocated to the top right corner from its previous middle right position. Moreover, cinema numbered 1 has been repositioned to middle left just below the toilet. On the other hand, new shops of refreshments and DVD’s are set up near the entrance replacing cinema number 1 and drinks shop respectively. Furthermore, A leisure room is also made available near the entrance for people to relax. The toilet room, ticket section and entrance position is kept the same over the given time period of four decades.
Great writing Aashish but be careful with punctuation and capilisation especially!

U r awesome buddy, thnx alot for this mind-blowing stuff

please review my writing for task 1 regarding the civic centre!

The maps illustrate a civic center at present and proposed changes for the future. Overall, it can be seen that the space occupied by car parking areas will be replaced by eateries, and both the car parking and the library will be shifted below the ground level.
Presently, along the North Avenue, there is a cinema hall in the middle with two parking lots at its both sides. The future plan delineates that a cafeteria will be built in place of a car park situated at the north west of the center, while hotel and restaurant will occupy the north east parking space.
The Victoria Avenue, which is located in the south of the civic center has an exhibition at the south west corner, close to the high street. Next to it, are council offices and then a town hall. Moving further to the east, in close access to the smith street, is shopping center and a library. In the future, council offices will be shifted to the bottom left, whereas exhibition will be moved to the bottom right of the center. Construction of an underground library will take place where there are council offices at present, and a new parking space will be provided below the town hall.
Nice writing but be careful with subject/verb agreement and using articles.
The overview is also a bit specific.
Keep working hard though!

The map demonstrates the modification that took place in cinema hall over two-year period from 2010 to 1012.
Overall, it is seen that the area of movie theater was planned to expand its area with new facilities like restaurant, showers and coordination. All rooms were made bigger in size.
one of the key changes over two years was overall extension of area of cinema hall. Dressing room was replaced by coordination hall and shifted to top left corner of the hall. Similarly, storage room was converted into admin office. Stage and auditorium were expanded to larger in size. Likewise, ticket office was shifted to the room where there used to be café which was upgraded to a bigger restaurant replacing admin office and ticket office with some extension.
Showers were the facility that was added in 2012 which can be accessed on the south of the dressing room. The space immediately after main entrance was utilized for restaurant.
Nice writing, Roshna!
Modification isn’t a word we would use for this kind of map though.
Also be careful with your articles especially.

The above map delineates the present condition of a civic centre and its future expansion plan. From an overall perspective quite a few changes are planned for the future along with some extra facilities.
At present the cinema hall is in the North of the map with car parking in Northwest and Northeast. The position of the cinema hall would remain unchanged but the parking in Northwest would be replaced by a café while a hotel and a restaurant are planned to replace the parking in Northeast. The exhibition center is in the Southwest west direction which would be replaced by council offices, and exhibition center would take place of library located in Southeast. The position of townhall would not be changed, but an underground parking would be developed under it. The library which would be replaced by exhibition centre would be moved underground next to car parking. The place where the shopping centre stands will remain unchanged in the future.
Good work, Shweta!
Careful with your use of would – try using the passive voice: is planned/projected to.

how to write this in report form
You can click on the sample answers to see…

The chart given illustrates the relation between the abroad student and local student from in Australian universities between 2011 and 2010. The line graph is given illustrate the midyear population per million in China, India, and the USA between 1950 and 2000. Overall, the USA was stand steady throughout the whole time. However, India and china registered a significant increased population. Firstly, the population of the USA was less than two hundred million in 1950. And after fifty years it become about 300 million in 2000, which is less than India and China in 1950 Secondly, India showed a rapid growth between 1950 and 2000, which it has started in under 400 million to more than double the number at the end (1000 million). Also, china started in approximately 600 million, then maintained the same level from 1959 to 1962). Finally, from 1963 china population sharply rise until the population reached about 1300 million.
See my other comment, Muna!
The chart given illustrates the relation between the abroad student and local student from in Australian universities between 2011 and 2010.
The line graph is given illustrate the midyear population per million in China, India, and the USA between 1950 and 2000. Overall, the USA was stood steady throughout the whole time. However, India and China registered a significantly increased population.
Firstly, the population of the USA was less than two hundred million in 1950. And after fifty years it becomes about 300 million in 2000, which is less than India and China in 1950
Secondly, India showed a rapid growth between 1950 and 2000, which it has started at under 400 million to more than double the number at the end (1000 million). Also, china started at approximately 600 million, then maintained the same level from 1959 to 1962). Finally, from 1963 china’s population sharply rise until the population reached about 1300 million.
Nice writing, Muna!
Careful with your helping verbs and main verbs and your subject/verb agreement!

The rendered pie chart and table illustrates job opportunities for Anthropology graduates after completing their undergraduate degree course from a university and salaries of Anthropology graduates after 5 years of work respectively.The data is calibrated in percentage.
Looking from an overall perspective, it is evident that majority of Anthropology graduates are employed on full-time basis. Whilst only a small fraction of student graduates work part-time and continue their postgraduate study. A large number of graduates receive average salaries when employed in private companies wheres the highest wages are acquired in government sector.
To commence with, about 52% of Anthropology graduates work on full-time basis, followed by 15% of students engaged in part-time jobs. Out of total graduates 12% of them are unemployed. Anthropology graduates continuing full-time postgraduate study and those whose data is not known are equal at about 8%. A minimum ratio of about 5% students continue to work part-time along with their post graduate study.
Furthermore, $25,000-50,000 salary is given to 5% graduates by both freelance consultants and in government sector whereas, private companies offer such range of salary to about 10% students after 5 year’ work. Fraction of graduates getting salary between half a million and a million is 15-40% in freelance consultants, about 15-30% in government sector and 35-25% in private companies. 50% of Anthropology graduates receive salary of more than a million dollars while in freelance consultants and private companies it is 40% and 30% respectively.
Nice work though a little bit on the long side – aim for about 175 words!
It is a tough one. Try to add in some more commas on your complex sentences as well.

how much band score would you give to the task?
You can sign up here to find out: Patreon.com/howtodoielts

The displayed bar graph spell out the information pertaining about the total time spent on phone calls in UKin three different categories during the time frame from 1995 to 2002.
Beginning with local calls it is evident from the graph that the figures ascend by leap and bounds from the year 1995 to 1999.Morever, the striking feature of the graph was in the year 1999 with the highest minutes accounting upto 90 billion.However, the figures plunged and the ratio continued to decrease till the end of the period with 72 billion in 2002.On the contrary, if talked about national and international calls ratio it can be highlighted that the ratio began with the lowest i.e. around 38% but saw a considerable growth during the end of the period which means to reach a peak of 60 billion in 2002.
Meanwhile, all calls ratio witnesses a modest increase continuing till 2002. In addition, the ratio started with 5 billion and saw a slight rise till 1998. Afterwards, the figures boosts up and reaching to almost 45 billion.
Thus to wrap up it can be finally commented that national and international calls ratio rose steadily.Similarly, all calls ratio also rose gradually.

How much band score would u give to this report .
Nice work, Richard!
There are too many informal phrases though like ‘leaps and bounds’.

Sir how much band score I can achieve?

Discuss about 2 task

The line graph depicts the French and English teacher’s employment ratio in Ontario starting from 2001 and ending 6 years later in 2007. At first glance, it can easily be seen that while the figure for French-language teachers showed an upward trend, the percentage of English-language teachers declined. Although, French-language teachers initially had a lower rate. it outraced the English-language teachers at the end of the period. In 2001, the English-language teachers’ recruitment rate was about 72%, being a bit higher than the French-language teachers’ one by approximately 3%. Then, it declined drastically until 2003, accounting for 40%. However, the figure showed a gradual increase to about 45%, over the next 2 years. After 2005, it continued to decrease, reaching its lowest point at about 28% at the end of the period. The employment ratio of French-language teachers was 70% in 2001 and over the next year decreased to about 52%. Then, the figure rose steadily to almost 70% in 2003 and continued to gradually grow until 2005, when it slightly dropped to about 68%. After that slight drop, it continued to increase, reaching its peak at about 72% in 2007. In summary, it is obvious that in Ontario French-language teachers were employed more than the ones who teach English. Word count: 214

I had a doubt in task 1. If you could please help. Is it a rule that we are not suppose to write ing form of words in writing task 1. Eg: looking ( looking from overall perspective) Fluctuating. Considering. Etc ?

please where is topics for task 1 2023

I’m sorry to ask ,but what is your Writing task 1 score for each of the sample writings here?
Exclusive Ebooks, PDFs and more from me!
Sign up for patreon.
Don't miss out!
"The highest quality materials anywhere on the internet! Dave improved my writing and vocabulary so much. Really affordable options you don't want to miss out on!"
Minh, Vietnam
Hi, I’m Dave! Welcome to my IELTS exclusive resources! Before you commit I want to explain very clearly why there’s no one better to help you learn about IELTS and improve your English at the same time... Read more
Patreon Exclusive Ebooks Available Now!
- Ebooks & Courses
- Practice Tests
IELTS Academic Writing Task 1
This page covers all the basic information you need to know about IELTS Academic Writing Task 1.
It includes:
- Key information
- Task overview
- Assessment & marking criteria
- The 7 types of questions
- Sample questions
Once you have a good understanding of Task 1, I’ll show you step-by-step how to produce high scoring essays for each of the 7 types of questions. You’ll find all these important lessons by following the links to the related pages.
Key Information
1) You are required to write 150 words or more.
If you write less than 150 words, you are unlikely to get more than a Band 5 for ’task achievement’ as you won’t have fulfilled the marking criteria.
2) You have around 20 minutes to plan and write your essay.
3) You should use a formal style of writing.
4) Task 1 contributes half as many marks to your score as Task 2. So, Task 1 is worth 33% of the total mark in the Writing test.
Task Overview
You will be presented with one of the following graphics:
- Table Chart
- Process Diagram
- Multiple Graphs
You are required to write a short report about the main features. For example, you may be asked to:
· summarise data
· describe the stages of a process
· explain how something works
· describe an object or event
The format of the question will always be the same. It will include:
· A brief description of the graphic
· The instructions
· The graphic – chart, graph, table, etc.
Here’s a typical question. The highlighted words are always the same no matter what type of question you get.
The line graph below shows the consumption of 3 different types of fast food in Britain from 1970 to 1990.
Summarise the information by selecting and reporting the main features, and make comparisons where relevant.

With the format of the question always the same, this means that you can use the same basic method and essay structure to write any essay for IELTS Academic Writing Task 1.
We’ll be looking at a model method and structure in the lesson on Planning an IELTS Academic Writing Task 1 Essay .
Assessment & Marking Criteria
As with all parts of the IELTS exam, Task 1 is marked according to four criteria.
- Task Achievement – appropriate response to the task
- Cohesion & Coherence – the ability to present a well-structured essay
- Lexical Resource (Vocabulary) – the ability to use a range of appropriate vocabulary and to use it correctly
- Grammatical Range & Accuracy – the ability to use grammar correctly and to use a range of grammar forms
Each carries 25% of the marks.
I’ve created separate lessons on Vocabulary and Grammar for Task 1, so here, we’ll look in more detail at just the marking criteria for Task Achievement and Coherence and Cohesion. We’re going to focus on Bands 6 - 8 as these are the levels most students are aiming for.
You can see a full table of all the band level marking criteria for Writing Task 1 by clicking this link – Task 1 Marking Criteria .
Here are the marking criteria for Task Achievement and Coherence and Cohesion. Don’t worry if the detail seems rather complex. Don't feel overwhelmed. If you follow my advice in all the lessons on how to write essays for IELTS Academic Writing Task 1, you’ll be able to meet these criteria and get a good score.
Marking Criteria – Task Achievement

Marking Criteria – Cohesion & Coherence

The 7 Types of Task 1 Questions
Now, we’re going to look briefly at the different type of questions for IELTS Academic Writing Task 1 and a sample question for each.
The biggest challenge for many students is that they are not used to working with charts, graphs and tables and don’t know how to interpret this type of data. Don’t worry about this for now as I’m going to show you how to do this in the step-by-step guides.
On this page, I just want to familiarise you with the question structure and the different types of graphics you might get.
First, a reminder of the 7 question types:
Click the links for step-by-step instructions on how to write each type of essay, including a model answer.
1) Bar Chart
Bars charts or bar graphs are very common Task 1 questions. The data can be presented vertically, as in the example below, or horizontally.
The bar chart below shows numbers of seals, whales and dolphins recorded in the Gormez Straits from 2006 to 2018.
Write at least 150 words.

2) Line Graph
Line graphs are also common in IELTS Academic Writing Task 1. They are easier to interpret than they may look.
The graph below shows the population for India and China since the year 2000 and predicts population growth until 2050.

Source: Official website IELTS Essentials
Tables also come up regularly in Task 1. Some students find these harder to interpret as they are just sets of numbers with no visual representation. However, they are never very complicated. Remember, the IELTS exam is designed to test your language skills, not your mathematics ability.
The tables below give information about the world population and distribution in 1950 and 2000, with an estimate of the situation in 2050.

Click this link for step-by-step instructions on how to answer this question including a model answer:
Table Chart – Instructions & Model Answer
4) Pie Chart
Although pie charts are not as common as bar charts and line graphs, you need to know how to answer this type of question in case you do get one. They are just another way of visually presenting data.
The chart below shows the reasons why people travel to work by bicycle or by car.

Pie Chart – Instructions & Model Answer
5) Process Diagram
Another less frequent question type is the process diagram. It could be a natural process such as the water cycle, a manufacturing process or the diagram of a system such as the central heating system in a house.
The diagrams below show a structure that is used to generate electricity from wave power.
Write at least 150 words.
Generating Electricity From The Sea

Process Diagram – Instructions & Model Answer
Occasionally, the IELTS Academic Writing Task 1 question will be about a map. It may ask you to compare two or three maps of a place over a period of time as in this question.
The diagrams below show the changes that have taken place at Queen Mary Hospital since its construction in 1960.

7) Multiple Graphs
Multiple graph questions have more than one type of diagram and are fairly common. They usually include two diagrams such as a bar chart and a line graph or a pie chart and a table as in this sample question.
The diagrams below give information on transport and car use in Edmonton.

Now that you have a better understanding of IELTS Academic Writing Task 1 and are familiar with the 7 different question types, you’re ready to learn how the write a Task I essay.
Just follow the links below to the individual lessons.
Want to watch and listen to this lesson on IELTS Academic Writing Task 1?
Click on this video.
Would you prefer to share this page with others by linking to it?
- Click on the HTML link code below.
- Copy and paste it, adding a note of your own, into your blog, a Web page, forums, a blog comment, your Facebook account, or anywhere that someone would find this page valuable.
Like this page?
Ielts academic writing task 1 – all lessons.
IELTS Academic Writing – A summary of the test including important facts, test format & assessment.
Academic Writing Task 1 – The format, the 7 question types & sample questions, assessment & marking criteria. All the key information you need to know.
Understanding Task 1 Questions – How to quickly and easily analyse and understand IELTS Writing Task 2 questions.
How To Plan a Task 1 Essay – Discover 3 reasons why you must plan, the 4 simple steps of essay planning and learn a simple 4 part essay structure.
Vocabulary for Task 1 Essays – Learn key vocabulary for a high-scoring essay. Word lists & a downloadable PDF.
Grammar for Task 1 Essays – Essential grammar for Task 1 Academic essays including, verb tenses, key sentence structures, articles & prepositions.
The 7 Question Types:
Click the links below for a step-by-step lesson on each type of Task 1 question.
- IELTS Writing
- Academic Writing Task 1
- Back To Top
* New * Grammar For IELTS Ebooks

$9.99 each Full Set Just $ 23.97
Find Out More >>
IELTS Courses

Full details...

IELTS Writing Ebook

Discount Offer
$7 each Full Set Just $ 21

Find out more >>
Testimonials
“I am very excited to have found such fabulous and detailed content. I commend your good work.” Jose M.
“Thanks for the amazing videos. These are ‘to the point’, short videos, beautifully explained with practical examples." Adari J.
"Hi Jacky, I bought a listening book from you this morning. You know what? I’m 100% satisfied. It’s super helpful. If I’d had the chance to read this book 7 years ago, my job would be very different now." Loi H.
"Hi Jacky, I recently got my IELTS results and I was pleased to discover that I got an 8.5 score. I'm firmly convinced your website and your videos played a strategic role in my preparation. I was able to improve my writing skills thanks to the effective method you provide. I also only relied on your tips regarding the reading section and I was able to get a 9! Thank you very much." Giano
“After listening to your videos, I knew I had to ditch every other IELTS tutor I'd been listening to. Your explanations are clear and easy to understand. Anyways, I took the test a few weeks ago and my result came back: Speaking 7, listening 9, Reading 8.5 and Writing 7 with an average band score of 8. Thanks, IELTS Jacky." Laide Z.
Contact
About Me
Site Map
Privacy Policy
Disclaimer
IELTS changes lives.
Let's work together so it changes yours too.
Copyright © 2024 IELT Jacky
All Right Reserved
IELTS is a registered trademark of the University of Cambridge, the British Council, and IDP Education Australia. This site and its owners are not affiliated, approved or endorsed by the University of Cambridge ESOL, the British Council, and IDP Education Australia.
IELTS Mentor "IELTS Preparation & Sample Answer"
- Skip to content
- Jump to main navigation and login
Nav view search
- IELTS Sample
Academic Writing Task 1 Sample
Ielts academic - graph writing:.
More Resources:
Useful Vocabularies and Phrases Preparation Tips IELTS Bar Graph | IELTS Line Graph | IELTS Table Chart | IELTS Flow Chart | IELTS Pie Chart |
20 Recent IELTS Graphs with answers
40 Difficult IELTS Graphs with answers
| 334958 | |
| 120311 | |
| 237258 | |
| 179415 | |
| 345410 | |
| 280125 | |
| 253205 | |
| 315817 | |
| 114391 | |
| 65696 | |
| 65961 | |
| 57610 | |
| 64201 | |
| 52164 | |
| 44209 | |
| 95479 | |
| 49833 | |
| 58181 | |
| 78754 | |
| 84451 |
Page 1 of 17
IELTS Materials
- IELTS Bar Graph
- IELTS Line Graph
- IELTS Table Chart
- IELTS Flow Chart
- IELTS Pie Chart
- IELTS Letter Writing
- IELTS Essay
- Academic Reading
Useful Links
- IELTS Secrets
- Band Score Calculator
- Exam Specific Tips
- Useful Websites
- IELTS Preparation Tips
- Academic Reading Tips
- Academic Writing Tips
- GT Writing Tips
- Listening Tips
- Speaking Tips
- IELTS Grammar Review
- IELTS Vocabulary
- IELTS Cue Cards
- IELTS Life Skills
- Letter Types

- Privacy Policy
- Cookie Policy
- Copyright Notice
- HTML Sitemap
- A Beginner’s Guide to IELTS
- Common Grammar Mistakes [for IELTS Writing Candidates]
Writing Correction Service
- Free IELTS Resources
- Practice Speaking Test
Select Page
How to Structure IELTS Writing Task 1 Essays
Posted by David S. Wills | Aug 24, 2020 | IELTS Tips , Writing | 1

I have written many times about structure on this website, but mostly I have focused on task 2 . Today, however, I am going to take some time to show you how to structure IELTS writing task 1 essays . This often seems like a mystery but in fact it is quite simple and you can usually follow a pretty basic template.
I am going to divide this lesson into two parts. First, we will deal with the IELTS Academic exam and then we will look briefly at the IELTS General exam because these require different structures. Also, keep in mind that IELTS academic writing includes line graphs, pie charts, bar charts, maps, and more, so each of these might require some changes to the essay structure.
IELTS Academic Writing Task 1 Structure
When you do IELTS academic writing task 1, you may find yourself presented with one (or more) of the following:
- Process diagram
These require quite different language but generally you can apply a similar essay structure to all of them. Whether you are writing about a line graph or a table, you can pretty much use this IELTS writing task 1 template :
| Paragraph #1 | Explain the basic facts of the image Describe the general trend |
| Paragraph #2 | Describe the first group of information |
| Paragraph #3 | Describe the second group of information |
Let’s establish what “group of information” means
When you are doing IELTS Academic writing task 1, you need to examine the data and then describe it. To do this, you cannot just take a random approach and write about the different features of the data. Instead, you need to highlight the important parts.
This can be difficult, so let’s take an example.

In this line graph, we only have two lines to write about. Clearly, we could write one paragraph about men and one paragraph about women. Easy! Our structure would look like this:
| Paragraph #1 | It’s a line graph about smoking rates Men increase; women decrease |
| Paragraph #2 | Describe the trend for men |
| Paragraph #3 | Describe the trend for women |
To be honest, that is a very, very easy graph to describe so it was not a challenge. Let’s choose something more difficult to explore:

This is not a terribly difficult line graph to describe, but it presents a challenge for our IELTS writing task 1 structure template. How should we group these three lines?
One option is to structure it like this:
| Paragraph #1 | It’s a line graph about tourism They have opposite trends |
| Paragraph #2 | Describe the trend for visitors on the island |
| Paragraph #3 | Describe the trend for visitors on ships |
Another option is to break the information down according to time:
| Paragraph #1 | It’s a line graph about tourism They have opposite trends |
| Paragraph #2 | Describe the data during the first few years |
| Paragraph #3 | Describe the data during the final years |
Grouping by Time vs Grouping by Type
The easiest way to group data for IELTS writing task 1 is to put them into different types. For example, in this line graph about a Caribbean island, we could potentially describe the number of people who stayed on the island in one paragraph and then the people who stayed on the ships in another paragraph.
But is this the best way?
When you write an essay with that structure, it becomes harder to compare the data. Remember that your question will always say “make comparisons where relevant.”
This suggests that grouping by time is better for one major reason: You can compare the different types of data over time. In this case, we can see the two sets of data are opposites, which gives us a great chance to make comparisons.
Sample Essay
Here is my sample essay about the Caribbean island.
The line graph displays the numbers of tourists that visited an unnamed Caribbean island between 2010 and 2017. The tourists are divided into two groups – those staying on cruise ships and those staying on the island itself – and these had a loosely inverse correlation. The total number of visitors, however, rose more or less continuously throughout the eight-year period. In the first year recorded, which was 2010, there were about twice as many tourists staying on the island as those staying on cruise ships. A year later, the number staying on cruise ships doubled to a half million, but this dropped back to around a quarter million in 2012. When the figures for tourists on cruise ships dropped, the number staying on the island rose quickly and over the coming few years, as this sudden increased levelled off, the number of people who stayed onboard their ship continued to grow again. Between 2012 and 2017, there were more and more visitors staying on cruise ships. From just a quarter million, this rose to two million, while the figures for those on the island levelled off at just one and a half million and then dropped slightly in the penultimate year, before finishing at one and a half. This meant that, for the final two years, more tourists stayed on cruise ships than on the island.
Can you write more than 3 paragraphs?
I would like to make clear that there is no such thing as the correct IELTS writing task 1 essay structure. It is possible to write a great essay with 2 paragraphs, but it is also possible to do it with 4 paragraphs. I would not recommend writing more than 4 paragraphs and I would certainly not recommend writing just 1! This would show a total lack of understanding of Coherence and Cohesion.
(P.S. – Read all about the number of paragraphs for IELTS writing task 2 here .)
Anyway, let’s look at an example of an essay that might be best described with 4 paragraphs:

For this task, we have to decide how to group the data. I personally find that the trend for burglary is more interesting than the others because it has much more of a change, which tells me that it should be described first. You could definitely write a paragraph that grouped car thefts and robberies together, but one is much more common than the other, so it might not work well.
I would take this approach:
| Paragraph #1 | It’s a line graph crime rates Burglary most common at start, but overtaken by car theft. |
| Paragraph #2 | Describe the trend for burglary |
| Paragraph #3 | Describe the trend for car theft |
| Paragraph #4 | Describe the trend for robbery |
Of course, writing this much could mean taking a long time and potentially not finishing your essay. I have written an article about how many words you should write for IELTS, which you can read here .
Sample Essay – 4 Paragraphs
Ok, let’s look at the essay I wrote about crime rates in Newport.
The line graph shows changes in crime rates over a ten-year period in the city centre of Newport. Three types of crimes are listed, two of which ended the period at roughly similar levels to where they began, and one experienced a major drop. In 2003, which was the beginning of the recorded period, burglary was the most common type of crime in Newport, with just under 3,500 cases reported. This rose slightly the following year, before entering into a long downward trend, reaching a low of about 1,200 in 2008. After this, the number of burglaries reported fluctuated until 2012. The number of car thefts was about 2,800 in 2003, and ended the period slightly lower, at 2,700. During the decade-long period, it fluctuated, reaching low points in 2006 and 2008. Car theft was the second most common type of crime in 2003, but the fall in burglaries meant that from 2008 onwards, they were the most common crime in Newport. Robberies were the least common crime and followed a somewhat similar trend to that of car thefts, starting and ending the period with around 700 incidents. It fluctuated only slightly during the ten-year period.
IELTS Writing Task 1 Pie Chart Structure
The previous examples were both line graphs because these are the most common type of IELTS academic writing task 1 question. However, in order to ensure you understand fully, I will also include a pie chart and show you how to structure your essay.
This is actually the most difficult IELTS writing task 1 question I have ever seen!

So how could we produce an IELTS writing task 1 essay structure to fit this?
The obvious choice seems to be writing 3 paragraphs, with 1 paragraph for each of the pie charts. That’s sensible, right?
Well, personally I think that would make it harder to draw comparisons between these data. Instead, I will group the data in terms of meals . I will look at the main meals in one paragraph and then snacks in a final paragraph. This allows me to compare all 3 nutrients!
My structure would then look like this:
| Paragraph #1 | There are 3 pie charts about nutrients 2 pie charts are the same; 1 is different |
| Paragraph #2 | Talk about breakfast, lunch, and dinner, comparing the various nutrients |
| Paragraph #3 | Talk about snacks |
**Please note that this is a quite advanced structure and it is difficult to do. I am including it to show you how it is possible to take various approaches and produce a great essay.
Sample Answer
This is my answer to the very difficult question about nutrients:
The pie charts show information about three different kinds of nutrients and their prevalence in typical American meals. There are four kinds of meal mentioned, including snacks. The figures for sodium and saturated fat are loosely similar, but for added sugar they are quite different. Sodium and saturated fat are both extremely common in typical American dinners. According to the pie charts, 43% of sodium is consumed at dinner time as well as 37% of saturated fat, but just 23% of added sugar is found in American dinners. Almost a third of sodium eaten by Americans is consumed at lunch, alongside more than a quarter of saturated fat. Breakfasts contain the lowest amount of these potentially unhealthy ingredients, at 14% sodium and 16% for both saturated fat and added sugar. The figures for snacks look quite different. More than four tenths of the added sugar consumed by Americans came from snacks, which also contained a fifth of the saturated fats and about a sixth of sodium.
IELTS General Training Writing Task 1 Structure
When you take the IELTS General Training (GT) writing test, you will see that task 1 requires you to write a letter. As such, there is no “recommended essay structure” that you can use.
Instead, you should aim to write a letter that follows typical letter-writing conventions and to use paragraphs logically to guide your reader.
How can you structure an IELTS general writing task 1 letter?
I would strongly recommend this sort of approach:
| Paragraph #1 | Say why you are writing |
| Paragraph #2 | Explain the issue |
| Paragraph #3 | Say what you want the other person to do |
Of course, I will say here that you should not take this as a 100% perfect letter template . It is merely a suggestion and you should pay close attention to the actual task you are assigned. This template can usually be adapted to make a good letter, but sometimes you need to add or combine paragraphs. Also, we might have a short paragraph at the start and/or end of the essay to give some friendly greeting or send some kind regards.
For one thing, sometimes you need to give much more weight to one part of the question, which could require using two paragraphs for that and one for the other parts. An example would be:
| Paragraph #1 | Say why you are writing |
| Paragraph #2 | Explain the issue |
| Paragraph #3 | Continue explaining the issue |
| Paragraph #4 | Say what you want the other person to do |
How to Adapt an IELTS General Writing Task 1 Format Structure
The people who score band 8 or 9 in IELTS writing are not the ones who memorize structures and vocabulary, or who attempt to predict the questions they will encounter. Instead, these are people who can learn from others but create their own essays and letters by adapting good ideas to the present situation.
Let’s look at an example question from IELTS GT writing task 1.
A large company in your area has decided to spend a certain amount of money, either to sponsor a local children’s sports team for two years, or to pay for two open-air concerts. It has asked for feedback from the general public. Write a letter to the company. In your letter, – describe the benefit of sponsoring the sports ream – summarise the benefits of paying for the concerts – say how you think the company should spend the money
How can we structure a reply to this task?
I am going to use the IELTS general writing task 1 format structure that I suggested above, with two paragraphs of explanation in the middle because there are two sides to the issue. My structure would look like this:
| Paragraph #1 | Say why I am writing |
| Paragraph #2 | Explain the benefits of sponsoring a sports team |
| Paragraph #3 | Explain the benefits of paying for a concert |
| Paragraph #4 | Give my opinion – the sports team is a better option |

Here is my sample answer to the above question:
Dear Sir or Madam, I am writing in response to your request for input on the decision about either spending money on a sports team or for two open-air concerts. Firstly, if you were to sponsor the children’s sports team, it would obviously be a great investment in the community. Nothing is more important to us than our children’s health and happiness. If you decided to sponsor the football team, this would mean a tremendous amount to many families. The concerts would also be beneficial in bringing the community together in a big event. This would foster some positive experiences and allow people to have fun together doing something they don’t normally do. It might also be good for local businesses. It is my opinion that you invest the money in the sports team as I think this would have the greatest benefit. For two whole years, parents would be able to watch their children play sports, and that is much better than going along to two concerts. Sincerely, David Wills
More Resources
This is a massive topic to cover and so I suggest that you continue reading once you are finished with this article. I have countless lessons on this website about IELTS writing task 1 (both academic and general) that you can read. I also have an IELTS writing task 1 template PDF file here .
More articles about structure:
- How to Describe a Bar Chart
- 7 Steps to Structuring an IELTS Essay
- How to Describe a Process Diagram
About The Author

David S. Wills
David S. Wills is the author of Scientologist! William S. Burroughs and the 'Weird Cult' and the founder/editor of Beatdom literary journal. He lives and works in rural Cambodia and loves to travel. He has worked as an IELTS tutor since 2010, has completed both TEFL and CELTA courses, and has a certificate from Cambridge for Teaching Writing. David has worked in many different countries, and for several years designed a writing course for the University of Worcester. In 2018, he wrote the popular IELTS handbook, Grammar for IELTS Writing and he has since written two other books about IELTS. His other IELTS website is called IELTS Teaching.
Related Posts
![Advantages and Disadvantages [IELTS Writing]](https://cdn.shortpixel.ai/spai/q_lossy+ret_img+to_webp/ted-ielts.com/wp-content/uploads/2020/02/advantages-and-disadvantages-ielts-writing-440x264.png "ielts writing essay task 1")
Advantages and Disadvantages [IELTS Writing]
February 25, 2020

IELTS Topics: Shopping
May 5, 2020

The Key to IELTS Success is… Simple Language?
August 14, 2019
![Describe a Popular Person [IELTS Speaking]](https://cdn.shortpixel.ai/spai/q_lossy+ret_img+to_webp/ted-ielts.com/wp-content/uploads/2023/06/Describe-a-Popular-Person-in-your-Country-1-440x264.png "ielts writing essay task 1")
Describe a Popular Person [IELTS Speaking]
June 5, 2023

I liked the course very much. It extended my knowledge about IELTS task 1 essay writing. This article is very insightful, points well explained and use of tutorials and examples to give a more clear picture of how task 1 essay should be tackled. Thanks for the great post! I liked how detailed and helpful it is.
Leave a reply Cancel reply
Your email address will not be published. Required fields are marked *
This site uses Akismet to reduce spam. Learn how your comment data is processed .
Download my IELTS Books

Recent Posts
- Cambridge IELTS 19 – Sample Answers
- Commas and Time Phrases
- Ambition and Success: Sample IELTS Essay
- Do the Advantages Outweigh the Disadvantages? – Advice About This Question Type
- Exams vs Continual Assessement [Model Essay]

Recent Comments
- David S. Wills on Writing Correction Service
- raquel on Writing Correction Service
- Lesson Plans
- Model Essays
- TED Video Lessons
- Weekly Roundup
IELTS Preparation with Liz: Free IELTS Tips and Lessons, 2024

- Test Information FAQ
- Band Scores
- IELTS Candidate Success Tips
- Computer IELTS: Pros & Cons
- How to Prepare
- Useful Links & Resources
- Recommended Books
- Speaking Part 1 Topics
- Speaking Part 2 Topics
- Speaking Part 3 Topics
- 100 Essay Questions
- On The Day Tips
- Top Results
- Advanced IELTS
Structure & Paragraphs for IELTS Writing Task 1
Learn how many paragraphs for your IELTS Writing Task 1 with tips about where to put your overview statement. In writing task 1, the examiner will mark you on your structure as part of the marking criterion of Coherence & Cohesion, which is 25% of your marks. Below you learn about how to structure your writing, how to organise information into the right paragraphs and which paragraph is the most important.
IELTS Writing Task 1 Structure
In writing task 1, you will be asked to write a report for a bar chart, line graph, table, pie charts, maps or diagram. All IELTS Writing Task 1 have the same structure, regardless of which task you are given. There are four main paragraphs that you need to use for task one. Only occasionally will there be five.
Introduction Paragraph
Overview paragraph.
- Body Paragraph 1
- Body Paragraph 2
- Body Paragraph 3 (not usual, but occasionally possible)
Remember, IELTS writing task 1 is a report, not an essay. This means the structure will be different and the examiner is looking for an overview, not a conclusion.
IELTS Writing Task 1 Paragraphs
Below read about the individual paragraphs you need in your writing task 1 report.
The first paragraph will be your introduction and that contains a description of the graph – what it shows. IELTS will always give you a description and you can use that information for your introduction but don’t copy it. You need to paraphrase it. So write it again using your own English.
This is your chance to introduction information such as categories, titles, headings, names, dates etc. Make sure your introduction is complete. It is usually one sentence but sometimes it can also contain a second sentence about the measurement of units.
This paragraph is the most important paragraph in your IELTS writing task 1 report. This is where you collect all the key features shown in the task and present them together. This paragraph has a direct impact on your band score for Task Achievement, which is 25% of your score. You can read more about the band scores here: IELTS WRITING TASK 1 BAND SCORES 5-8 TIPS. But to give you an idea:
- Band Score 5 = no clear overview
- Band Score 6 = a relevant overview is attempted (it is tried but not well done)
- Band Score 7 = presents a clear overview
- Band Score 8 = key features are skilfully selected (referring to the overview)
The clearer and more complete your overview paragraph is, the higher your score for Task Achievement. The biggest challenges with the overview are:
- not spotting all key features
- spreading key features into various paragraphs instead of into one overview paragraph
- presenting only one key feature
You can see examples of key features in all my model answers for writing task 1: ALL MODEL ANSWERS .
All writing task 2 reports have an overview no matter which task you get. An overview is not the same as a conclusion. Writing task 2 has a conclusion, writing task 1 has an overview. This is clearly stated in the IELTS Band Score Descriptors. An overview has a different function to a conclusion. See the video below:
An oldie, but a goodie. My older videos are still packed with useful tips. All still relevant today.
Overview or Conclusion Video
Body Paragraphs
These paragraphs (usually two) contain the details. If your task contains numbers, such as a chart, you will need to support your sentences with data. Failing to do that will lower your score for Task Achievement.
You should organise the details of the task into logical body paragraphs based on the key features. You should also take into consideration what type of task you have. For example, a bar chart shows comparisons between two things, such as men and women, for different categories so your aim is to compare men and women within each category. You would then see which categories are most popular and which are least and then organise categories into body paragraphs. Of course, it might not be about popularity, it might be about which categories have the biggest differences or the least differences. Which ever way you organise the information, it must be logical.
WRITING TASK 1 STRUCTURE & PARAGRAPHING – A SUMMARY
To sum up, it can feel complicated and overwhelming when you first start preparing for your writing task 1. So, I made this video years ago to sum up how to organise your task 1 report. It’s an old video, but of course still relevant today. The test hasn’t changed.
How to Organise Your Writing Task 1 Video
Another oldie which is still great today and reviews the paragraphing for writing task 1.
I hope you enjoyed this page and found it useful. I wanted to give you as much as I could because it’s so important to your scores. All the best, Liz
Now it’s time to review model answer for writing task 1 and see what the paragraph looks like. See links below:
RECOMMENDED FOR YOU
- Bar Chart: Model Band Score 9
- Pie Chart Paragraphs in Easy Steps
- ALL MODEL ANSWERS AND TIPS FOR WRITING TASK 1
FREE SUBSCRIBE Subscribe to get new lessons & tips by email. Email Address Subscribe
Thank you for all the help you provide! I was wondering if you have a similar video or page for structure and linking tips for the general training writing task 1? I’ve seen the general tips page, but no one for structure specifically. Thanks again! 🙂
Did you check the model letters? Use them to learn from. The structure is very simple. An opening line which will be different depending on each type of letter, the aims and the person you are writing to. Then each bullet point will be addressed in separate body paragraphs. Then a final comment before signing off. Go to the main writing task 1 page and see my model letters at the bottom of the page.
The map on top reveals the Pacific Railway station in 1998, while the map on bottom illustrates the current Pacific Railway station. In 1998 the Pacific Railway station had just one shop, a café, toilet facilities and small ticket office. Overall, we can see that Pacific Railway station has significantly changed since 1998 with increasing numbers in platforms and facilities available for customers. The station has developed and expanded. For instance, in 1998 there was only one shop located next to café and ticket office just half of the size of current and they didn’t have supermarket nor restaurant in 1998. They have added restaurant in between a new and old platform with removal of separate toilet facilities. In addition, they have increased the numbers of shops and moved them over to middle of station. Moreover, a supermarket has been built to the bottom left corner in front of recently built platforms. In conclusion it’s clearly seen that station has improved over twenty-four years.
Hello Liz. I took the computer based academic test yesterday. I forgot to keep a line empty to indicate paragraphs in both task 1 and task 2, do you think is it likely to reduce my score ? I wrote 5 paragraphs (if the examiner can see them) for task 1 (I paraphrased diagram in the first paragraph, gave overall information in the second, two body paragraphs with the structure ‘firstly, secondly’ and a conclusion paragraph in the end; for the task 2, I wrote four paragraphs (introduction, on the one hand, on the other hand, to conclude.)
There is no rule about leaving one line empty between paragraphs – it is a recommendation. If your paragraphs are easy to see, for example by indenting the first word, then it is fine. If the examiner cannot see your paragraphing, it could reduce your score for Coherence and Cohesion. There is no fixed rules about how it is reduced and your final score for the marking criterion will depend on other factors as well as the paragraphing.
Dear Liz, I have concerns regarding the flexibility in paragraphing the writing, particularly for the introduction and overview.
I have consulted so many books for IELTS preparations, but none discusses the exact number of paragraphs to be developed. Some of them show model answers by examiners, and they mostly (if not all, as much as I remember) join the introductory statement and general overview as one opening paragraph.
Do IELTS examiners conform to just one format of writing or do they allow these variations as long as the points are organized well enough to warrant a band score of 9? (CC criterion)
There is no set format. Your organisation of paragraphs must always be logical and divide information into logical groups. I usually put the overview with the introduction when I write a report for a diagram because their introductions are often extremely short. Otherwise, I like to keep it separate because it is such a vital part of your marks. the examiner must easily find your overview. It must not be something that is difficult to find. And it must not be something that is divided into different paragraphs – all key information must be in the overview. Sure, you can put it in the same paragraph as the introduction, but make sure it is a separate statement or statements. The overview is your most important part of task 1.
For the body paragraphs, use logical organisation based on the information you have to report. Divide the information into two or three body paragraphs. Two is the most usual. You cannot have only one body paragraph.
I hope this helps.
The Public Band Descriptor for writing Task 1 only mentions paragraphing for Bands 8 and 9 regarding Coherence and Cohesion. Does it imply that if the applicant writes a single paragraph for T1 the CC score can be 7 (given the other criteria are met)? Thank you in advance.
Those are the public descriptors, not the examiner’s descriptors. The examiner has a few extra points to consider. You won’t get over band 5 in CC if you write it all without paragraphs. This means if you write it in a block without dividing it into paragraphs, you will get band 5 in CC.
Hello Mrs. Liz
Mrs. in task1, specifically pie charts. Is it Ok to just analyze each diagram in one paragraph or I need to combine both and structure them into two body paragraphs? And If I described each chart in one paragraph will I be able to get a 6.5/7
Note: I will make comparisons in the overview and the concluding sentence
There is no rule or advice for all pie charts. It depends what the pie charts show. It depends if the pie charts are comparable or if they each show specific changes over time. The approach will be different depending on the information given.
Thank you for your fantastic explanation and advice. I would like to ask you one crucial question. What is the difference between Body Paragraph A and Body Paragraph B?
I am looking forward to your answer!
Best wishes, Liz
I don’t fully understand your question. You have two body paragraphs because you are dividing the information given into two groups based on similarities or key features. The body of the report must always be divided – two is the usual, three is not so common.
I purchased all your video lessons for task 2. Do you also have paid videos for task one? I find it very difficult because the tasks/charts/graphs are greatly varied. Some charts have a lot of important information/points. If i put them all in the report, I will be left with few minutes in writing task 2. Are ielts examiners really strict about the IMPORTANT information from the charts? For instance, in some tasks, there are a lot of IMPORTANT pieces of information and it’s difficult to select only few. But if i write them all, i’d lose time for writing task 2. If the examiners see nine/9 IMPORTANT pieces of information from the chart/graph etc., but I only put 6 because of the time limit, will my band score be affected? I am aiming for a band score of 7. I find task 1 really depressing. Thank you Liz.
Part of the marking criterion of Task Achievement is your ability to select information. You should have about two or three key features for the overview. You should have about two body paragraphs. Given that you will not write more than 200 words – I’m sure you can calculate how much information you can put in your body paragraphs. Look at ALL my model answers for task 1, count the sentences and this will help guide you as to how much information you can put in it.
Thank you liz for your advice!
Hi Liz, Can we put both of the introduction and the overview in the same paragraph? Usually, the introduction is only two sentences and so is the overview. It seems a bit odd to me to put them into seperate paragraphs. I would really appreciate your insight on this.
It is possible to do that. Just make sure that the introduction and overview are separate statements clearly visible in the same paragraph.
Thank you Liz. You are the best 🙂
Hello Liz, is it possible to send you my work so you Mark for me? I don’t mind paying any required fee. Regards.
Sorry, I don’t offer that service.
Hi mam, My English will never be enough to thank you for you,r effort in you,r website . i,m going to have the test when i,m sure that all the types of the questions are familier to me but till now i want to thank you again for the help you give for free especially for citizens of devoloping countries like mine and and i want to do it in a practical way .So whenever you decide to visit Egypt you can ask me to be you,r free tour guide and that will be a very little thing to do for you .
It’s always best to take IELTS when you feel completely ready and you are sure of what you are doing. I wish you lots of luck! Thank you for your offer – Egypt is a fascinating country 🙂
Tnx liz for teaching us am really proud on u may god bless u😇☺🤗
Hello Liz, i’m a member of EssayForum and the primary contributor uses the term “summary overview” and that includes the introduction and 1-2 trend statements similar to an overview all in 1 paragraph. Is it advised to do this? She seems a bit strict about this but it’s different from what i was taught.
It is possible to put your introduction and overview in one paragraph. But there must be a distinction between which sentence is your introduction and which one is your overview. The first sentence should be an introduction. The second sentence should start with “Overall” and be your overview. Otherwise, put your overview either after your introduction in a separate paragraph or at the end of your task 1.
Mam Is it okay to write 3-4 bodyparagraphs in task 1,excluding introduction and overview?
The most is two or three body paragraphs excluding the intro and overview.
hi Liz! i just watched the video regarding the four paragraphs for writing task 1. I wasn’t able to catch up the specific details to put in the last two paragraphs. Thanks a lot!
All tips and model answers are on this page: https://ieltsliz.com/ielts-writing-task-1-lessons-and-tips/
This implies that there is no place for conclusion in task 1
This is a report, not an essay. It is short, it contains an overview rather than a conclusion. A conclusion is a paragraph that repeats (re-states) the main points – there is no need to repeat information in a short report.
Hi, Liz! Thanks for your lessons! I’d like to clearify smth: is overview supposed to stay seperately? I think overview must stay within the introduction. Also, is it necessary to have at least 3 paragraphs?
The overview can be put with the introduction in the same paragraph. But the statements must be separate, even though they are in the same paragraph.
I am appearing for General Training on 07-03-2018, the video task 1 has confused me about the overview, Do we need to write an overview for General Training Task 1 ?
GT writing task 1 is a letter, not a report. See this page: https://ieltsliz.com/ielts-letter-writing-essential-tips/
Do I have to use listing such as, firstly, secondly at the start of my body paragraphs when writing the task 1 (report) in academic writing? Like how we do in task 2? or can I just start with the factual information?
Appreciate your response as my exam is on 23rd March in the morning. 🙂 Thank you very much for your lessons Liz. Truly grateful.
– Madhu
See this page for writing task 1 tips and model answers: https://ieltsliz.com/ielts-writing-task-1-lessons-and-tips/
Hello Liz Ma’am, I am trying to subscribe you, but I don’t get any confirmation emails. What do I do?
Subscribe on this page: https://ieltsliz.com/subscribe-ielts-lessons/ . Try a different email address if it doesn’t work. I’m on holiday at the moment so I’m not posting any new lessons.
Hi Liz, I had my IELTS exam past weekend. Thank You for the guidance and bits of advice you’ve given throughout the time.
Writing task 1 was describing a map. Writing task 2 was about online shopping and its impacts on environment and job opportunities.
Speaking test, cue card was about an incident which you were pleased to have the mobile phone with you. and the rest was about mobile phones.
I’m glad to share my exam experience.
I wish all my friends the Best of Luck to achieve a high band score!
Thanks for sharing 🙂
hello liz, i have a question: can i use this same structure when writing a line graph, table or other type of charts?? thank you
The structure of a report remains the same for all academic writing task 1.
Hi Ms. Liz. Regarding the overview for task 1, is it necessary to write it as another paragraph? or we can just include the overview in the introduction? thank you
The overview can be put with the introduction but you must make sure that the overview statement is very clear. You don’t mix them. The introduction is one statement and the overview is another statement that starts with Overall – make the two distinct. However, in most cases, it is best to separate them.
I am going to take IELTS general test in next month, Do you have a tutorial on General writing task 1 (paragraph and sentence structure)?
Waiting for your response..
See this page: https://ieltsliz.com/ielts-letter-writing-essential-tips/
Hi LIZ I m still confused as what will come in GT tests? In writing no graphs etc are included , only letters are there . Is it right?
Can you send me all the links for GT reading,writing , listening and speaking. Thanks
See this page: https://ieltsliz.com/ielts-gt-academic-writing-differences/ and then review this page: https://ieltsliz.com/ielts-general-training-reading-information/ . As for speaking and listening, there is no special test for Gt students. ALL students take the same speaking and listening tests.
Hello, Liz. In the process diagrams, do I need to write an overview?? Especially that it doesn’t have anything standing out in particular; it’s a normal process.
All writing task 1 for the academic test have an overview. You need to pick the key stages in the diagram for your overview. See this page: https://ieltsliz.com/ielts-writing-task-1-lessons-and-tips/ and then see this page about indenting: https://ieltsliz.com/ielts-writing-task-2/
Hi Liz, please give more posts on Map, Describing process, and Multiple task for writing task 1. I really need it
Hello Liz, Firstly I want to thank you from my bottom of my heart for all your IELTS tips and preparation .I have a question for you -I’m really confused whereas the overview in task 1 should be after the introduction or in the last paragraph of the essay,because I have seen many task1 essays with band 9 score that have their overview at the end .Also can we use for the overview phrases such as :to sum up,in summary,to summarise or not .Once more thank you so much!!!!!! I’m looking forward to your reply!
Please see this video: https://ieltsliz.com/ielts-tips-conclusion-or-overview-for-writing-task-1/ and then review all links and tips on this page: https://ieltsliz.com/ielts-writing-task-1-lessons-and-tips/
Great job Your nice as well as simple elaboration on developing the task one is absolutely conducive for the enthusiastic language (English) learner’s. Great thanks to u
very helpful and useful in every content. Thank you Liz
Liz your website is not responsive and I am unable to watch it on my mobile properly, please do something this error could be resolved by a web designer so please do it as soon as possible. Its half content is cut from right side.
This website is responsive to mobile phones. Which pages are you specifically referring to?
I’ve got the same problem. I have to turn the phone sideways in order to read the right side of the page
The current page has this issue. I can read only in landscape mode. I am on Android.
My website layout has changed recently and I’m still working on fixing it.
Is two body paragraphs required or they could’ve combined into one? If it is required, how should they be separated? By time, groups or it doesn’t matter? Thank you
You need to divide the body paragraphs into two – although occasionally three are possible.
Hi, Liz! Is it important to compare all the categories compared on the bar charts? I am concern with the time, and I have seen some Task 1 writing samples that only compared the most remarkable features. Thanks for all your work.
It depends on the chart you get. Some charts contain little information and to write over 150 words, you will need to include everything. Other charts contain so much information that you must choose what to put in your task 1 report. You will be marked on being selective of information when you have a lot to choose from.
Does overview mean the conclusion?
The overview is a statement which contains all key features. A conclusion is a statement which summarises and repeated the points given. Task 1 is a report and it should not contain repeated information – you have an overview, not a conclusion. See the main writing task 1 page: https://ieltsliz.com/ielts-writing-task-1-lessons-and-tips/
I wanted to ask you mam that do we write numeric information in an overview or conclusion
It is common to put totals in, for example for a table. However, the detail and figures usually go in the body paragraph. There is no fixed rule, it is just a recommendation.
I had my speaking test today. topic was: to discuss on a place that i recently visited. a: what sort of place was that. b: which type of people can go there.
It went good. hoping for a good score.
Thanks for sharing 🙂 Fingers crossed for a good score 🙂
i have follow up your lessons , its so clear , i was keep watching you tube to get more knoweledge about ielts. always keep smiling face and very clear words ,very easy to catch the ielts exam for all students. many thanks
You are the perfect teacher ,when I watch you lecturing it’s like watching the Mona Lisa, you are fascinating .THANK YOU.
Mam, can we use furthermore in task 1???
Yes, if it is appropriate.
With all due respect, I had earlier requested you to review an essay that I had written for writing part 1 but did not receive any reply for it. It would be rather encouraging if you could assist me in how I could improve on my writing band score for part 1. Please do reply at the earliest as my test is scheduled for next week.
Sorry but I don’t offer free essay correction or comment on writing.
I;m writing for the first time so it is hihgly appreciated, how I can to develop my self in writing particula in reporting ( statment structure ) could you please increase my enthasisum
I don’t understand what you want. However, see the main writing task 2 page: https://ieltsliz.com/ielts-writing-task-2/ . Or get my advanced lessons: https://ieltsliz.com/ielts-writing-task-2/
hi mom, i love all of your video…… your explanations is very clearly and very helpful for my IELTS preparation thanks a million
You’re welcome 🙂
Writing task 1 (academic) we need to use past tense or present tense?
Look at the dates provided. If there are no dates, use present tense.
Can I write overview at the last after introduction , B1 , B2 and then overview ???
The video above explains this.
I’m attending GT in next week.In Writing Task-1 does it get only a letter or there is a chance of getting charts/Table?? Kindly reply me @ earlier
See this page: https://ieltsliz.com/ielts-gt-academic-writing-differences/
is it possible that i share my own writing so that you point out me my deficiencies?
Sorry I don’t offer comments on writing.
Hello Mam Are you available to give classes or tuition for ielts.i am from Luton.Thanks.Love to hear from you.
Hi, if you would like more lessons, please see my advanced writing task 2 lessons: http://subscriptions.viddler.com/IELTSLizStore
hi liz….your lessons are very helpful…..can u please guide me where can i get my writing task s checked,,,,please if there is any online source,,,help me,,,,i need a band 7+,,,
Hello mam, I’m from india,as i have an ielts exam after 1 month but i do not know from were to start and how to do the practise from home as i need a 7 band in academic so kindly help me out from this stuff as i’m quite scared,
https://ieltsliz.com/liz-notice-2015-2016/
Hi liz Is it compulsory to write a conclusion in task 1. Also is it OK to write a conclusion for task 1 diagrem. Thanks.
hello mam…..
mam i have one question. you said in your lecture that task 1 should be written in different paragraphs like introduction, overview……now we have to mention these subheadings before writing actual paragraphs or not???
See my model answers to see how they should be written. Liz
one of our instructors advise is to 3 – 4 paragraphs is enough for task 1. he usually merge the introduction (paraphrasing) and overview and key points into one paragraph, and that is paragraph one.. is this okay? thanks..
You should always divide the detail into two body paragraphs. If you fail to do that you will get a lower score for coherence and cohesion. Liz
Yes Liz, I have no problem with regards to dividing the body paragraphs to two details.. My prob is do I still have to separate the introduction (paraphrasing) from the overview? Because our teachers here always tell that the introduction and overview are merge to paragraph one.. Thank you so much for your help Liz..
The overview is usually put separately as an individual paragraph. However, it is possible to put it with the introduction. The detail should always be divided into two (occasionally three) body paragraphs. https://ieltsliz.com/writing-task-1-report-structure/ Try to read all my lessons before asking questions – this has already been explained clearly. All the best Liz
Hi liz . I am nina and i will take an IELTS exam on 29 October 2016 . I am taking general English, so do tou have any informations of an IELTS test 2016 . Can you give me? I would like to practice before i take an IELTS exam.Thanks.
Do you mean current exam questions? See this page: http://www.ieltsliz.com/recent-ielts-questions-and-topics
Thanks! You explained it well. But im still confused because some of ielts teacher has an overview after their intro and has a conclusion at the bottom part. How’s that?
It’s a bad example. You are being marked on your ability to organise information into paragraphs. Firstly, you should not repeat information in a short report. Remember this is a report, not an essay. Secondly, you should not divide key features into two different places, you should collect it and present it as one overview. Thirdly, the examiner is look for an overview in task 1 and a conclusion in task 2. The main problem is that many IELTS teachers have not completed the IELTS examiner training which is why they are not clear about how to organise the report and what the examiner is looking for. All the best Liz
Okay I got it. I will just follow what you said. Thank you 🙂
Hi maam! I sent you the sample of ielts writing task1 where i get confused, i send it on your email. Many thanks! 🙂
Sorry, I don’t offer essay marking. All the best Liz
Hi Ms. Liz. I just want to ask how will i know if my essay contains 150 or 250 words already. Thank you and God bless you.
See this video: https://ieltsliz.com/ielts-answer-sheet-writing/ Liz
Liz, Can I use pencil for writing task 1 and 2???
See this page for info: https://ieltsliz.com/ielts-help-faq/ Liz
I can’t express how much grateful to you for your charity on teaching IELTS!!!!!!!! Really I’m what I can say…………………. Thanks a lot ………………….
Dear Liz, I am so grateful to what you have done for IELTS candidates, including me , of course. I browse your website very often, especially, your youtube channel. I am reviewing for my next exam which may be in the end of this year. My target is 7.0 overall, but in my last trial, I got 6.5. Could you gimme some advice on how to improve from 6.5 to 7.0. Again, thank you so much for your useful lessons.
Please see the band score pages to see the difference between band scores. All tips given on this blog are for the higher scores – band 7, 8 and 9. Liz
Hi! Thank you very much for the comprehensive IELTS lessons and video tutorials you are sharing which are indeed very helpful especially to us non-native English speakers. I have learned so much from you and I really appreciate the effort you put into it. God bless you, ma’am.
Hi Mam, i should say your videos are really really helpful to someone like me who is preparing self for the ielts exam. i do have some doubts regarding the writing part of the general test because I’m misguided by many. Does the task 1 ask for letter writing or does it include graphs too? Looking forward for your guidance. Regards Aswathi
If you are taking the GT test, you will write a letter. If you do the academic test, you will get a graph, chart or something similar. Please see this page: https://ieltsliz.com/ielts-writing-task-1-faq/ . And see this page to practice writing task 1 and learn more: https://ieltsliz.com/ielts-writing-task-1-lessons-and-tips/ . You should read the information pages and band score pages. Liz
thank u soo much for the information ma’m.
plz i want to prepare the ielts general training.
Hi Liz, Actually I had given ielts exam twice but both of time I am scored 5.5 in writing.
The reason is due to your level of English. If you make many mistakes in English and have limited control of the language, it will be difficult to get over band 5. For example, in the sentence you wrote above, there are 4 mistakes. Frequent errors will reduce your score significantly. You will need to improve your level of English to be able to produce more accurate language in order to get a good score. All the best Liz
Hi Madam, really you are excellent English language teacher. your tutorial on you tube helped me very well not only for IELTS but also for my academic writing. Really God bless you !
That’s really good to know. I’m glad my lessons are helpful 🙂 Liz
Dear teacher, You explained that for writing task 1 it should have 4 paragraph, so is it important to have conclusion for writing task 1? Please could you explain about this? Thanks a million!
You will find all information about overviews and conclusions on this page: https://ieltsliz.com/ielts-writing-task-1-lessons-and-tips/ . Please see the tips and videos section. Liz
Speak Your Mind Cancel reply
Notify me of follow-up comments by email.
Notify me of new posts by email.
ADVANCED IELTS LESSONS & E-BOOKS
Recent New Lessons
50% discount on advanced ielts – ends today, ideas in ielts essays & in ielts speaking, test yourself with linking words, ielts speaking part 2 cue card topics – 2024, new reading exercise for you (july 2024).

Click Below to Learn:
- IELTS Test Information
- Writing Task 1
- Writing Task 2
Copyright Notice
Copyright © Elizabeth Ferguson, 2014 – 2024
All rights reserved.
Privacy Policy & Disclaimer
- Click here: Privacy Policy
- Click here: Disclaimer
Return to top of page
Copyright © 2024 · Prose on Genesis Framework · WordPress · Log in

A Complete Guide on IELTS Academic Writing Task 1
In Academic Writing Task 1, you will be given one or multiple diagrams that can be in many forms such as, graphs, pictures, data tables etc. You will be asked to write an essay on the given diagrams.
You will need to write at least 150 words for this essay. Yes, you can write a few more than 150, but never go below 150. If you write even 149 words, you will lose marks. To be in the safe zone, write 170-180 words. However, we recommend not exceed 190. If you write 195/200/200+, it will be too many words and will damage your score.
In fact, you are required to show how well you can communicate in English. Understanding the question properly and then answering precisely is one of the important communication skills. If you write less than the instructed number of words, or if you write too many words, the examiner will get the impression that you have failed to understand the basic instruction sentence.
3 Simple Steps for Academic IELTS Writing Task 1
You need to do three simple things for Academic IELTS Writing Task 1. This is all you have to do for this task:
Paraphrase the question sentence
Write an overview paragraph
Focus on one or two key features
If you can cover just these 3 bullet points within 160-180 words, you are absolutely fine.
Task 1 Question Types
There are 7 types of questions for Academic IELTS Writing Task 1. Click on each question type to read their step by step detailed discussions.
A pie chart is a circular statistical graph which is divided into slices that illustrate proportional relationship.
A line graph is a line that is connected with individual data points showing quantitative variations over the time.
A bar chart presents categorical data with rectangular bars with heights or lengths proportional to the values that they represent.
Table Chart
You might be given one or two data tables. You will need to describe the significant data changes for the given time.
Process Diagram
You will be given a picture or a drawing that shows the production steps of a final product, or the working procedure of a mechanical device/machine etc. Most of the students fear this question not because it is difficult, but because of their confusion how to answer this.
This is a very easy question to answer. There will be no data to analyse in this question type. It will be all about comparing between 2 or 3 maps.
Multiple Graphs
There will be more than one data diagrams. You will need to describe major changes or relations among them.
Writing Task 1 Essay Structure
Paraphrasing the question sentence
Overview paragraph
The first body paragraph
The second body paragraph
It's actually very easy to get a good score in IELTS writing task 1. Just write the major features that are very obvious in the graphs. Don't write anything that is minor or not in the graph. Click Academic IELTS Task 1 essay structure and jump to the detailed discussion.
Check the following resources:
A complete guide on IELTS Writing
A complete guide on General Training Writing Task 1
A complete guide on Writing Task 2 (GT + Academic)
All IELTS Academic Writing Task 1 Types (+Tips & Examples)
IELTS Academic Writing Task 1 can be a challenging test for many students. One of the reasons for this is the variety of question types that may appear on the test, including bar charts, line graphs, pie charts, tables, maps, diagrams, and more. However, understanding the different types of questions and how to approach them can make all the difference in achieving a high score.
In this blog post, we will explore all of the different types of IELTS Academic Writing Task 1 questions that may come up on the test. We will also provide examples and tips on how to approach each type of question, so you can feel confident and prepared on the test day.
Types of IELTS Academic Writing Task 1 Question
Here are all of the different IELTS Academic Writing Task 1 question types you need to know:
1. Describing a Line Graph
Line graphs are used to show trends or changes over time.

- What is the chart representing?
- What is the unit of measurement?
- Is there a specific time frame or interval shown?
- How many lines are displayed on the chart?
- What is the tense used in the description of the chart?
- Study the x-axis and y-axis labels and the units of measurement.
- Look for trends, fluctuations, and significant points on the graph.
- Introduction: Paraphrase the question.
- Identify the main trend(s) or pattern(s) in the graph.
- Highlight the main trends or patterns.
- Provide a broad description of the data, including any significant changes or fluctuations.
- Describe the trend and the significant changes.
- Break down the data by showing specific data points and trends.
- Compare and contrast the data if applicable.
- Use linking words and phrases to connect the data points and trends.
- Use a variety of verbs to describe trends, such as “rise,” “increase,” “grow,” “fall,” “decrease,” “drop,” and “level off.”
- Use adjectives to describe the degree of change, such as “dramatic,” “significant,” “moderate,” or “slight.”
- Use linking words and phrases to connect ideas and show relationships, such as “while,” “although,” “despite,” and “due to.”
- Use the simple present tense to describe general truths or ongoing trends, such as “the data shows,” “the graph indicates,” or “the trend is.”
- Use the past tense to describe specific data points or changes, such as “in 2015, the figure was,” “there was a sharp increase in,” or “the numbers fell dramatically.”
- Sample line graph and model answer:

It is important to identify the key features of the graph, such as:
- The highest and lowest points
- The overall trend
- Any significant changes
2. Describing a Bar Graph
Bar graphs are used to compare data between different items or groups.

- What is the main subject of the bar chart?
- What are the units of measurement used?
- Are the bars arranged in any particular order?
- How many categories or groups are being compared?
- What is the overall trend displayed in the chart?
- Identify the different categories on the x-axis and the values on the y-axis.
- Look for comparisons and contrasts between the bars.
- Identify the main differences or similarities between the categories.
- Compare the highest and lowest bars and any significant differences.
- Provide a brief description of the data, including any significant differences.
- Describe the comparison between the items or groups.
- Break down the data by showing specific data points and comparisons between the categories.
- Highlight the significant differences.
- Use linking words and phrases to connect the data points and comparisons.
- Use appropriate adjectives to describe the size or quantity of each category, such as “large,” “small,” “significant,” or “minor.”
- Use linking words and phrases to compare and contrast categories, such as “in contrast,” “on the other hand,” and “similarly.”
- Use the simple present tense to describe general truths or ongoing comparisons, such as “the chart shows,” “the data indicates,” or “the difference is.”
- Use the past tense to describe specific data points or comparisons, such as “in 2015, the figure for A was,” “B had a higher percentage than,” or “there was a significant contrast between.”
- Sample bar graph and model answer:

- The highest and lowest bars
- The most and least popular items
- Any significant differences
3. Describing a Pie Chart
Pie charts are used to show data percentages of a whole.

- What does the pie chart represent?
- What are the percentages or proportions shown?
- Are there any significant differences between the sections of the chart?
- What is the largest or smallest section of the chart?
- What conclusions can be drawn from the chart?
- Identify the different categories and their corresponding percentages.
- Look for the largest and smallest slices and any notable differences.
- Identify the largest and smallest slices and any significant differences.
- Compare the largest and smallest slices and any significant differences.
- Provide a brief description of the data.
- Describe the proportions of the groups
- Highlight the most and least represented groups
- Use percentages and fractions to describe each category.
- Use adjectives to describe the degree of difference between categories, such as “marked,” “slight,” or “significant.”
- Use linking words and phrases to show relationships between categories, such as “corresponding to,” “accounting for,” and “contributing to.”
- Use the simple present tense to describe general truths or ongoing proportions, such as “the pie chart illustrates,” “the data suggests,” or “the largest slice is.”
- Use the past tense to describe specific data points or proportions, such as “in 2015, the percentage for C was,” “D accounted for a smaller proportion than,” or “there was a slight shift in the distribution from.”
- Model answer:

It is important to identify the key features of the chart, such as:
- The largest and smallest segments
- The most and least represented groups
4. Describing a Table
Tables are used to present data measurements in a structured format.

- What is the main topic or subject of the table?
- What are the categories or variables being compared?
- How are the values arranged within the table?
- Are there any significant differences or patterns in the data?
- What are the highest or lowest values in the table?
- Study the headings and units of measurement for each column and row.
- Look for patterns, rankings, and comparisons.
- Identify the highest and lowest values and any significant differences.
- Break down the data by showing specific data points and comparisons between the rows and columns.
- Highlight the most and least profitable professions.
- Use appropriate adjectives to describe the size or quantity of each row or column, such as “lowest,” “highest,” “most,” or “least.”
- Use linking words and phrases to compare and contrast rows or columns, such as “in contrast,” “on the other hand,” and “similarly.”
- Use the simple present tense to describe general truths or ongoing rankings or comparisons, such as “the table presents,” “the data compares,” or “the figures show.”
- Use the past tense to describe specific data points or rankings, such as “in 2015, the number for X was,” “Y had the highest total of,” or “there was a significant difference between Z and.”

It is important to identify the key features of the table, such as:
- The highest and lowest values
- The most and least profitable professions
5. Describing a Map
Maps are used to show a location or a facility such as a street map and a plan of a building or site.

- What does the map show?
- What is the scale of the map?
- Are there any significant features or landmarks highlighted on the map?
- What is the overall trend or pattern shown in the map?
- What conclusions can be drawn from the map?
- Identify the key features of the map, such as roads, buildings, landmarks, and areas of open space.
- Look for patterns, such as the layout of streets or the distribution of buildings.
- Identify any changes or developments over time.
- Summarize the main stages and the overall process.
- The location of the shops or facilities.
- Highlight the distance between them.
- Describe the key features of the map in a logical and organized way.
- Use linking words and phrases to connect the different features.
- Use prepositions to describe the location of features, such as “to the north of,” “adjacent to,” or “surrounded by.”
- Use adjectives to describe the size, shape, or function of features, such as “large,” “narrow,” or “commercial.”
- Use the simple present tense to describe general truths or ongoing features or locations, such as “the map displays,” “the data identifies,” or “the area is.”
- Use the past tense to describe specific data points or locations, such as “in 2015, the building was,” “there used to be a park where,” or “the river flowed through.”

It is important to identify the key features of the map, such as:
- The location of different shops or facilities
- The distance between them
6. Describing a Process/Diagram
Process diagrams are used to show the stages or steps in a process and their order.

- What is the process being shown in the diagram?
- What are the main stages or steps in the process?
- Are there any key inputs or outputs shown in the diagram?
- Are there any significant changes or transformations in the process?
- What is the final outcome or result of the process?
- Identify the different stages or steps in the process and their order.
- Look for the inputs, outputs, and transformations that occur.
- Look for any significant changes or developments.
- Identify the main stages of the process and the inputs, outputs, and transformations that occur.
- Describe the main steps and the significant changes of the process in detail and the key features of each.
- Use linking words and phrases to connect the different stages.
- Use appropriate verbs to describe each stage of the process, such as “input,” “transform,” or “output.”
- Use linking words and phrases to show the sequence of stages, such as “after,” “before,” “subsequently,” and “finally.”
- Use the simple present tense to describe general truths or ongoing stages or transformations, such as “the diagram represents,” “the data outlines,” or “the process involves.”
- Use the past tense to describe specific data points or stages, such as “in the first step, the input was,” “there was a change in the output from,” or “the transformation led to.”

It is important to identify the key features of the diagram, such as:
- The starting and ending points
- The main steps
7. Describing Combination
A combination task may include two or more types of graphs or diagrams, and it requires candidates to compare and contrast the information presented.

- What types of charts or diagrams are included in the combination?
- What is the main topic or subject of the combination?
- How are the various elements of the combination related to each other?
- What is the overall trend or pattern shown in the combination?
- What conclusions can be drawn from the combination?
- Study the different elements of the visual representation and how they relate to each other.
- Look for patterns, trends, and comparisons between different types of data.
- Identify the different elements of the visual representation and how they relate to each other.
- Describe each element in detail and the key features of the different types of graphs or diagrams
- Compare and contrast the data presented.
- Use linking words and phrases to connect the different elements and show their relationships.
- Use appropriate language for each type of visual representation and show how they are related to each other.
- Use linking words and phrases to connect ideas and show relationships, such as “whereas,” “in comparison,” “in addition,” and “moreover.”
- Use appropriate tenses for each type of visual representation and make sure they are consistent throughout the analysis.
- Use linking words and phrases to connect ideas and show relationships between different tenses, such as “while,” “although,” “despite,” and “due to.”

In conclusion, the IELTS Academic Writing Task 1 test can be challenging, but understanding the different types of questions and how to approach them is crucial to achieving a high score. By familiarizing yourself with line graphs, bar charts, pie charts, tables, maps, and combinations thereof, you can feel confident and prepared on test day.
Remember to focus on the key trends, comparisons, components, data points, and features, and use specific data to support your analysis. With these tips and examples in mind, you can be well on your way to achieving your desired score.
Related Posts

25 Expert Tips For IELTS Academic Writing Task 2 Success

21 Complex Sentence Structures For IELTS Writing Task 1

100 Common Phrases For IELTS Academic Writing Task 2
Leave a comment cancel reply.
Your email address will not be published. Required fields are marked *
Save my name, email, and website in this browser for the next time I comment.
Plans & Pricing
IELTS Academic Writing Task 1 Topics September & October 2024
The collection of the recent IELTS Academic Writing Topics is a compilation of topics which have been recently used in IELTS Academic Writing Task 1. These topics cover a wide range of topics, from everyday topics such as shopping and leisure activities to more complex topics such as healthcare, economics, and technology. The topics are chosen from past IELTS exams and reflect the kinds of topics students may be asked to write about in their upcoming IELTS exam. The Collection of the recent IELTS Academic Writing Topics provides students with useful practice material to help them prepare for the IELTS exam.
Choose one of the topics and practice your writing skills daily. If you are having difficulty coming up with your own topic ideas, simply click the "Answers" button and you will be presented with a range of possible topics.

Write on this topic Answers ···

- Unlimited Task 1 checks Get all the feedback you need to keep improving your charts and letters.
- Unlimited Task 2 checks Practice and perfect your skills with essays.
- Personalized suggestions Know how to boost your score.
- Detailed mistakes analysis Get instant feedback. Spot every mistake.
- Topic ideas generator Get topic-specific ideas to enhance your writing.
- Vocabulary helper Get the right words for any topic.
- Progress tracking Track your writing improvements.
What are You Looking for?
- Writing Task 1
- Writing Task 2
IELTS Writing Task 2: Free Mental Health Services – Sample Essays and Analysis
Mental health is a crucial aspect of overall well-being, and the topic of Free Mental Health Services has been gaining traction in IELTS Writing Task 2 exams. Based on recent trends and the increasing global focus on mental health, it’s highly likely that this theme will continue to appear in future IELTS exams. Let’s explore a relevant question that has been observed in past IELTS tests and could potentially resurface:
Some people believe that governments should provide free mental health services to all citizens. To what extent do you agree or disagree with this statement?
Analyzing the Question
This question asks for your opinion on whether governments should offer free mental health services to everyone. It’s crucial to:
- Clearly state your position (agree, disagree, or partially agree)
- Provide reasons and examples to support your stance
- Consider potential counterarguments
- Maintain a balanced perspective throughout your essay
Now, let’s look at sample essays for different band scores.
Sample Essay 1 (Band 8-9)
Mental health is an integral component of overall well-being, yet it often receives less attention and funding compared to physical health. I strongly agree that governments should provide free mental health services to all citizens, as this approach would yield significant benefits for individuals and society as a whole.
Firstly, universal access to free mental health services would ensure that all members of society, regardless of their financial status, can receive the care they need. Mental health issues do not discriminate based on socioeconomic status, and neither should access to treatment. By removing financial barriers, governments can promote early intervention and prevent the exacerbation of mental health problems, which often lead to more severe and costly consequences when left untreated.
Moreover, investing in mental health services can result in substantial long-term economic benefits for a country. A mentally healthy population is more productive, creative, and resilient, contributing positively to the workforce and economy. The World Health Organization estimates that for every $1 invested in mental health treatment, there is a $4 return in improved health and productivity. This demonstrates that providing free mental health services is not just a social obligation but also a sound economic strategy.
However, some may argue that offering free mental health services could place an excessive burden on government budgets. While this concern is valid, it’s important to consider the hidden costs of untreated mental health issues, such as increased healthcare expenditures, lost productivity, and social welfare payments. By investing in preventive care and early intervention through free mental health services, governments can potentially reduce these long-term costs.
In conclusion, the provision of free mental health services by governments is a crucial step towards creating a healthier, more equitable society. The benefits of such an initiative extend far beyond individual well-being, positively impacting the economy and social fabric of a nation. As mental health continues to gain recognition as a fundamental aspect of public health, it is imperative that governments take proactive measures to ensure universal access to these essential services.
(Word count: 316)
Essay Analysis
This essay demonstrates characteristics of a Band 8-9 response:
- Clear position : The writer strongly agrees with the statement and maintains this stance throughout.
- Coherent structure : The essay has a clear introduction, body paragraphs with distinct ideas, and a conclusion.
- Well-developed arguments : Each point is thoroughly explained and supported with examples or data.
- Sophisticated vocabulary : The essay uses advanced vocabulary accurately (e.g., “exacerbation,” “resilient,” “imperative”).
- Complex sentence structures : The writer employs a variety of sentence structures, including complex sentences.
- Cohesive devices : Appropriate linking words and phrases are used to connect ideas smoothly.
- Counterargument addressed : The essay acknowledges and responds to a potential opposing view.
Sample Essay 2 (Band 6-7)

Mental health is becoming more important in our society today. I agree that governments should provide free mental health services to all citizens because it can help many people and improve society.
One reason why free mental health services are good is that they can help people who cannot afford to pay for treatment. Many people with mental health problems don’t get help because it’s too expensive. If the government makes these services free, more people can get the help they need. This can stop small problems from becoming bigger and more serious.
Another benefit of free mental health services is that it can make society better. When people are mentally healthy, they can work better and be happier. This means they can contribute more to their community and the economy. Also, treating mental health problems early can prevent other issues like crime or homelessness, which cost the government money to deal with.
However, some people might say that providing free mental health services is too expensive for the government. It’s true that it would cost a lot of money at first, but in the long run, it could save money. If people are mentally healthy, they might need less help from other government services in the future.
In conclusion, I believe that governments should offer free mental health services to everyone. It would help individuals get the care they need and make society healthier and more productive. While it might be expensive at first, the long-term benefits are worth the investment.
(Word count: 262)
This essay demonstrates characteristics of a Band 6-7 response:
- Clear position : The writer agrees with the statement and maintains this stance throughout.
- Coherent structure : The essay has an introduction, body paragraphs with distinct ideas, and a conclusion.
- Developed arguments : Each point is explained and supported, though not as thoroughly as in the Band 8-9 essay.
- Appropriate vocabulary : The essay uses relevant vocabulary, though not as sophisticated as the higher band essay.
- Varied sentence structures : The writer uses a mix of simple and complex sentences.
- Basic cohesive devices : Some linking words and phrases are used to connect ideas.
- Counterargument addressed : The essay briefly acknowledges and responds to a potential opposing view.
Key Vocabulary
Mental health (noun) /ˈmen.təl helθ/: A person’s condition with regard to their psychological and emotional well-being.
Intervention (noun) /ˌɪn.təˈven.ʃən/: The act of becoming involved in a difficult situation in order to improve it or prevent it from getting worse.
Exacerbation (noun) /ɪɡˌzæs.əˈbeɪ.ʃən/: The act of making something worse.
Resilient (adjective) /rɪˈzɪl.jənt/: Able to quickly return to a previous good condition.
Imperative (adjective) /ɪmˈper.ə.tɪv/: Extremely important or urgent.
Proactive (adjective) /proʊˈæk.tɪv/: Taking action to cause change and not only reacting to change when it happens.
Universal access (noun phrase) /ˌjuː.nɪˈvɜː.səl ˈæk.ses/: The ability for all people to have equal opportunity to a service or product.
Long-term benefits (noun phrase) /lɒŋ tɜːm ˈben.ɪ.fɪts/: Advantages or improvements that will be experienced over an extended period.
Productivity (noun) /ˌprɒd.ʌkˈtɪv.ə.ti/: The rate at which a person, company, or country does useful work.
Socioeconomic status (noun) /ˌsəʊ.si.əʊ.iː.kəˈnɒm.ɪk ˈsteɪ.təs/: An individual’s or group’s position within a hierarchical social structure, based on wealth, occupation, and social status.
The topic of free mental health services is highly relevant in today’s society and is likely to appear in future IELTS Writing Task 2 exams. By understanding the key elements of a strong essay and practicing with sample questions, you can improve your writing skills and prepare effectively for the test.
Some other potential questions related to this topic might include:
- Should mental health education be mandatory in schools? Why or why not?
- Do you think employers should provide mental health support for their employees? Discuss the advantages and disadvantages.
- How can governments encourage people to take care of their mental health? Give reasons and examples to support your answer.
We encourage you to practice writing essays on these topics and share them in the comments section below. This active practice will help you refine your skills and prepare for success in your IELTS Writing Task 2 exam.
To learn more about related topics, you might find these articles helpful:
- Why Mental Health Services Should Be Free
- Universal Healthcare Challenges Worldwide
- Mental Health Awareness in Workplaces
- Education Vocabulary
- Health Vocabulary
- IELTS essay samples
- IELTS Writing
- Sample Essay
- Vocabulary List

IELTS Writing Task 2: Climate-Induced Displacement Essay Examples and Analysis

IELTS Writing Task 2 Sample Essays: Automation’s Effects on Middle-Class Job Opportunities

IELTS Writing Task 2: Mastering the Global Water Shortage Essay with Sample Answers for Every Band Score
IMAGES
VIDEO
COMMENTS
Writing Task 1 is a report, not an essay. Writing Task 1 counts for about 33% of your writing marks. ... IELTS writing task 1 free practice lessons to help you develop report writing skills and understand about the requirements of writing task 1 academic. Many of these lessons contain model answers so they really are worth reviewing.
Here you will find IELTS Writing Task 1 Samples for a variety of common tasks that appear in the writing exam. The model answers all have tips and strategies for how you may approach the question and comments on the sample answer. It's a great way to help you to prepare for the test.
IELTS Academic Writing Task 1 Samples. Get a band score and detailed report instantly. Check your IELTS essays right now! Read more ». Prepare for the IELTS Academic Test by using this collection of IELTS Academic Writing Task 1 practice samples. This collection is a great way to gain insight and practice for the exam.
Sample Essay 1 - Pie Charts. The pie charts show the ratio of goods shipped from Great Britain from 2010 to 2015. The products are measured by percentage. Overall, over the five-year period, the most exported goods were machinery and vehicles. These two types of goods were predominantly wanted out of all of the categories.
In the IELTS Academic Writing test, you will have one hour to complete both of the two set writing tasks. Keep an eye on the time it takes you to complete practice Tasks 1 and 2 to make sure you don't go too far over, and to use as a benchmark for how long you can expect each task to take you. In the actual test, you will move from the first ...
People doing the Academic test will write a report on a data set, map, or process. People doing General Training will write a letter. You must write 150 words or more. You should spend around 20 minutes on this part of the test. Task 1 is worth 1/3 of your total mark on the Writing test.
The resources below include an IELTS writing task 1 sample answer pdf. Line graph IELTS academic task 1 sample essay 26: Thermal conductivity of material at 25C. Line graph IELTS academic task 1 sample essay 7: January 2015 temperature variation in the Philippines. Line and bar chart IELTS academic task 1 sample essay 5: Common budget items chart.
Academic writing task 1 requires that you summarise and compare a diagram, chart or graph, talking about the main features. You should use at least 150 words for the task. This section is not an essay. It is a summary. You should use formal language and it must factual.
Eliot Friesen. on. April 7, 2021. in. IELTS Academic Writing Task 1. When you sit down for the Academic IELTS Writing Task 1 on test day, you'll see one or two visuals, such as a chart, diagram, or graph. You'll then write a report to give information based on key features of these visuals. Overall, you have 20 minutes to write 150 words.
The Test Format. The IELTS writing exam is a 60 minute test of your English writing ability and there are two parts - Task 1 and Task 2. For Task 1 (Academic) you will be given some data in the form of a chart, table, or process. You have around 20 minutes to write at least a 150 word summary of the data.The data comes in many different ...
The guide tells you everything you need to know about how Writing Task 1 essays and paragraphs should be structured, with an example question and model essay. IELTS Writing Task 1 Samples: The Major Question Types. Below are questions for each common infographic in IELTS Writing Task 1: bar charts, pie charts, line graphs, process diagrams, and ...
Evaluation Criteria for IELTS Writing Task 1. The purpose of the IELTS Writing Task 1 question is to assess a candidate's writing abilities. Four criteria are used to assess a candidate's IELTS score: Task Achievement, Coherence & Cohesion in IELTS Writing, IELTS Lexical Resource and IELTS Grammatical Range & Accuracy.
12 KEY STEPS FOR IELTS WRITING TASK 1 PREPARATION. Go through each of the points below to make sure you are preparing fully for your task 1. 1. Understanding Task 1. Task 1 is a report, not an essay. Reports have set structures, set language, set key features - they are more formulaic than an essay. This is important because it means with the ...
Read my sample answer for this (unusual) task 1 here. IELTS Essay: Bridges. Read my sample answer for this topic here. The bar graph shows the total manufacturing production in percentages Asia, Europe, and the rest of the world. ... IELTS Exam Writing Task 1 posted in Nhẩy đầm với IELTS by Đỗ Phương Thảo February 20th
Key Information. 1) You are required to write 150 words or more. If you write less than 150 words, you are unlikely to get more than a Band 5 for 'task achievement' as you won't have fulfilled the marking criteria. 2) You have around 20 minutes to plan and write your essay. 3) You should use a formal style of writing.
You will be allowed 1 hour to complete two tasks in the IELTS Academic Writing test. Prepare with our free materials.
In your IELTS Academic Writing Task 1, you will be given with one or more graph (s) (i.e. bar, column, line or pie), table, flowchart, map or process diagram and you need to summarise the main information, compare data, show contrasts and trends, identify significant trends and describe a process. You should write between 150 to 200 words and ...
Whether you are writing about a line graph or a table, you can pretty much use this IELTS writing task 1 template: Paragraph #1. Explain the basic facts of the image. Describe the general trend. Paragraph #2. Describe the first group of information. Paragraph #3. Describe the second group of information.
Remember, IELTS writing task 1 is a report, not an essay. This means the structure will be different and the examiner is looking for an overview, not a conclusion. IELTS Writing Task 1 Paragraphs. Below read about the individual paragraphs you need in your writing task 1 report. Introduction Paragraph
A Complete Guide on IELTS Academic Writing Task 1. In Academic Writing Task 1, you will be given one or multiple diagrams that can be in many forms such as, graphs, pictures, data tables etc. You will be asked to write an essay on the given diagrams. You will need to write at least 150 words for this essay.
All IELTS Academic Writing Task 1 Types (+Tips & Examples) April 21, 2023 / IELTS Writing Task 1. IELTS Academic Writing Task 1 can be a challenging test for many students. One of the reasons for this is the variety of question types that may appear on the test, including bar charts, line graphs, pie charts, tables, maps, diagrams, and more.
Writing Task 1. The graph below gives information on the numbers of participants for different activities. READ MORE >>. The Charts Below Give Information on the Location and Types of Dance Classes. READ MORE >>.
Check your IELTS essays right now! The collection of the recent IELTS Academic Writing Topics is a compilation of topics which have been recently used in IELTS Academic Writing Task 1. These topics cover a wide range of topics, from everyday topics such as shopping and leisure activities to more complex topics such as healthcare, economics, and ...
We encourage you to practice writing essays on these topics and share them in the comments section below. This active practice will help you refine your skills and prepare for success in your IELTS Writing Task 2 exam. To learn more about related topics, you might find these articles helpful: Why Mental Health Services Should Be Free