Have a language expert improve your writing
Run a free plagiarism check in 10 minutes, generate accurate citations for free.
- Knowledge Base
Methodology
- What is Secondary Research? | Definition, Types, & Examples

What is Secondary Research? | Definition, Types, & Examples
Published on January 20, 2023 by Tegan George . Revised on January 12, 2024.
Secondary research is a research method that uses data that was collected by someone else. In other words, whenever you conduct research using data that already exists, you are conducting secondary research. On the other hand, any type of research that you undertake yourself is called primary research .
Secondary research can be qualitative or quantitative in nature. It often uses data gathered from published peer-reviewed papers, meta-analyses, or government or private sector databases and datasets.
Table of contents
When to use secondary research, types of secondary research, examples of secondary research, advantages and disadvantages of secondary research, other interesting articles, frequently asked questions.
Secondary research is a very common research method, used in lieu of collecting your own primary data. It is often used in research designs or as a way to start your research process if you plan to conduct primary research later on.
Since it is often inexpensive or free to access, secondary research is a low-stakes way to determine if further primary research is needed, as gaps in secondary research are a strong indication that primary research is necessary. For this reason, while secondary research can theoretically be exploratory or explanatory in nature, it is usually explanatory: aiming to explain the causes and consequences of a well-defined problem.
Receive feedback on language, structure, and formatting
Professional editors proofread and edit your paper by focusing on:
- Academic style
- Vague sentences
- Style consistency
See an example

Secondary research can take many forms, but the most common types are:
Statistical analysis
Literature reviews, case studies, content analysis.
There is ample data available online from a variety of sources, often in the form of datasets. These datasets are often open-source or downloadable at a low cost, and are ideal for conducting statistical analyses such as hypothesis testing or regression analysis .
Credible sources for existing data include:
- The government
- Government agencies
- Non-governmental organizations
- Educational institutions
- Businesses or consultancies
- Libraries or archives
- Newspapers, academic journals, or magazines
A literature review is a survey of preexisting scholarly sources on your topic. It provides an overview of current knowledge, allowing you to identify relevant themes, debates, and gaps in the research you analyze. You can later apply these to your own work, or use them as a jumping-off point to conduct primary research of your own.
Structured much like a regular academic paper (with a clear introduction, body, and conclusion), a literature review is a great way to evaluate the current state of research and demonstrate your knowledge of the scholarly debates around your topic.
A case study is a detailed study of a specific subject. It is usually qualitative in nature and can focus on a person, group, place, event, organization, or phenomenon. A case study is a great way to utilize existing research to gain concrete, contextual, and in-depth knowledge about your real-world subject.
You can choose to focus on just one complex case, exploring a single subject in great detail, or examine multiple cases if you’d prefer to compare different aspects of your topic. Preexisting interviews , observational studies , or other sources of primary data make for great case studies.
Content analysis is a research method that studies patterns in recorded communication by utilizing existing texts. It can be either quantitative or qualitative in nature, depending on whether you choose to analyze countable or measurable patterns, or more interpretive ones. Content analysis is popular in communication studies, but it is also widely used in historical analysis, anthropology, and psychology to make more semantic qualitative inferences.

Secondary research is a broad research approach that can be pursued any way you’d like. Here are a few examples of different ways you can use secondary research to explore your research topic .
Secondary research is a very common research approach, but has distinct advantages and disadvantages.
Advantages of secondary research
Advantages include:
- Secondary data is very easy to source and readily available .
- It is also often free or accessible through your educational institution’s library or network, making it much cheaper to conduct than primary research .
- As you are relying on research that already exists, conducting secondary research is much less time consuming than primary research. Since your timeline is so much shorter, your research can be ready to publish sooner.
- Using data from others allows you to show reproducibility and replicability , bolstering prior research and situating your own work within your field.
Disadvantages of secondary research
Disadvantages include:
- Ease of access does not signify credibility . It’s important to be aware that secondary research is not always reliable , and can often be out of date. It’s critical to analyze any data you’re thinking of using prior to getting started, using a method like the CRAAP test .
- Secondary research often relies on primary research already conducted. If this original research is biased in any way, those research biases could creep into the secondary results.
Many researchers using the same secondary research to form similar conclusions can also take away from the uniqueness and reliability of your research. Many datasets become “kitchen-sink” models, where too many variables are added in an attempt to draw increasingly niche conclusions from overused data . Data cleansing may be necessary to test the quality of the research.
If you want to know more about statistics , methodology , or research bias , make sure to check out some of our other articles with explanations and examples.
- Normal distribution
- Degrees of freedom
- Null hypothesis
- Discourse analysis
- Control groups
- Mixed methods research
- Non-probability sampling
- Quantitative research
- Inclusion and exclusion criteria
Research bias
- Rosenthal effect
- Implicit bias
- Cognitive bias
- Selection bias
- Negativity bias
- Status quo bias
A systematic review is secondary research because it uses existing research. You don’t collect new data yourself.
The research methods you use depend on the type of data you need to answer your research question .
- If you want to measure something or test a hypothesis , use quantitative methods . If you want to explore ideas, thoughts and meanings, use qualitative methods .
- If you want to analyze a large amount of readily-available data, use secondary data. If you want data specific to your purposes with control over how it is generated, collect primary data.
- If you want to establish cause-and-effect relationships between variables , use experimental methods. If you want to understand the characteristics of a research subject, use descriptive methods.
Quantitative research deals with numbers and statistics, while qualitative research deals with words and meanings.
Quantitative methods allow you to systematically measure variables and test hypotheses . Qualitative methods allow you to explore concepts and experiences in more detail.
Sources in this article
We strongly encourage students to use sources in their work. You can cite our article (APA Style) or take a deep dive into the articles below.
George, T. (2024, January 12). What is Secondary Research? | Definition, Types, & Examples. Scribbr. Retrieved August 29, 2024, from https://www.scribbr.com/methodology/secondary-research/
Largan, C., & Morris, T. M. (2019). Qualitative Secondary Research: A Step-By-Step Guide (1st ed.). SAGE Publications Ltd.
Peloquin, D., DiMaio, M., Bierer, B., & Barnes, M. (2020). Disruptive and avoidable: GDPR challenges to secondary research uses of data. European Journal of Human Genetics , 28 (6), 697–705. https://doi.org/10.1038/s41431-020-0596-x
Is this article helpful?

Tegan George
Other students also liked, primary research | definition, types, & examples, how to write a literature review | guide, examples, & templates, what is a case study | definition, examples & methods, what is your plagiarism score.
- Skip to main content
- Skip to primary sidebar
- Skip to footer
- QuestionPro

- Solutions Industries Gaming Automotive Sports and events Education Government Travel & Hospitality Financial Services Healthcare Cannabis Technology Use Case AskWhy Communities Audience Contactless surveys Mobile LivePolls Member Experience GDPR Positive People Science 360 Feedback Surveys
- Resources Blog eBooks Survey Templates Case Studies Training Help center
Home Market Research
Secondary Research: Definition, Methods and Examples.

In the world of research, there are two main types of data sources: primary and secondary. While primary research involves collecting new data directly from individuals or sources, secondary research involves analyzing existing data already collected by someone else. Today we’ll discuss secondary research.
One common source of this research is published research reports and other documents. These materials can often be found in public libraries, on websites, or even as data extracted from previously conducted surveys. In addition, many government and non-government agencies maintain extensive data repositories that can be accessed for research purposes.
LEARN ABOUT: Research Process Steps
While secondary research may not offer the same level of control as primary research, it can be a highly valuable tool for gaining insights and identifying trends. Researchers can save time and resources by leveraging existing data sources while still uncovering important information.
What is Secondary Research: Definition
Secondary research is a research method that involves using already existing data. Existing data is summarized and collated to increase the overall effectiveness of the research.
One of the key advantages of secondary research is that it allows us to gain insights and draw conclusions without having to collect new data ourselves. This can save time and resources and also allow us to build upon existing knowledge and expertise.
When conducting secondary research, it’s important to be thorough and thoughtful in our approach. This means carefully selecting the sources and ensuring that the data we’re analyzing is reliable and relevant to the research question . It also means being critical and analytical in the analysis and recognizing any potential biases or limitations in the data.
LEARN ABOUT: Level of Analysis
Secondary research is much more cost-effective than primary research , as it uses already existing data, unlike primary research, where data is collected firsthand by organizations or businesses or they can employ a third party to collect data on their behalf.
LEARN ABOUT: Data Analytics Projects
Secondary Research Methods with Examples
Secondary research is cost-effective, one of the reasons it is a popular choice among many businesses and organizations. Not every organization is able to pay a huge sum of money to conduct research and gather data. So, rightly secondary research is also termed “ desk research ”, as data can be retrieved from sitting behind a desk.
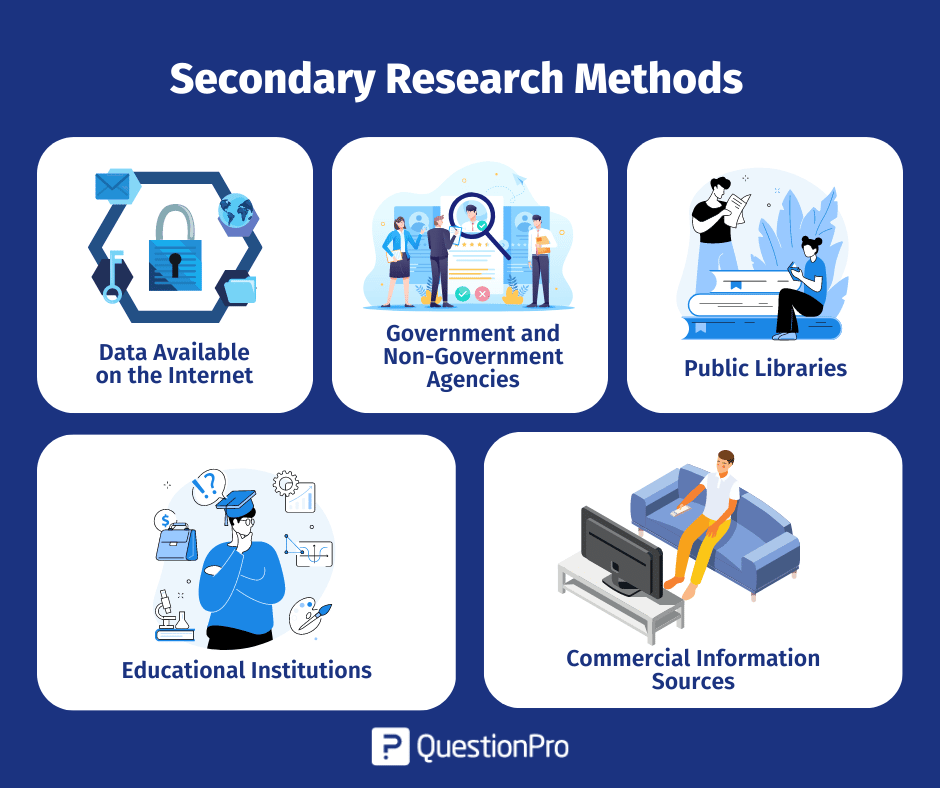
The following are popularly used secondary research methods and examples:
1. Data Available on The Internet
One of the most popular ways to collect secondary data is the internet. Data is readily available on the internet and can be downloaded at the click of a button.
This data is practically free of cost, or one may have to pay a negligible amount to download the already existing data. Websites have a lot of information that businesses or organizations can use to suit their research needs. However, organizations need to consider only authentic and trusted website to collect information.
2. Government and Non-Government Agencies
Data for secondary research can also be collected from some government and non-government agencies. For example, US Government Printing Office, US Census Bureau, and Small Business Development Centers have valuable and relevant data that businesses or organizations can use.
There is a certain cost applicable to download or use data available with these agencies. Data obtained from these agencies are authentic and trustworthy.
3. Public Libraries
Public libraries are another good source to search for data for this research. Public libraries have copies of important research that were conducted earlier. They are a storehouse of important information and documents from which information can be extracted.
The services provided in these public libraries vary from one library to another. More often, libraries have a huge collection of government publications with market statistics, large collection of business directories and newsletters.
4. Educational Institutions
Importance of collecting data from educational institutions for secondary research is often overlooked. However, more research is conducted in colleges and universities than any other business sector.
The data that is collected by universities is mainly for primary research. However, businesses or organizations can approach educational institutions and request for data from them.
5. Commercial Information Sources
Local newspapers, journals, magazines, radio and TV stations are a great source to obtain data for secondary research. These commercial information sources have first-hand information on economic developments, political agenda, market research, demographic segmentation and similar subjects.
Businesses or organizations can request to obtain data that is most relevant to their study. Businesses not only have the opportunity to identify their prospective clients but can also know about the avenues to promote their products or services through these sources as they have a wider reach.
Learn More: Data Collection Methods: Types & Examples
Key Differences between Primary Research and Secondary Research
Understanding the distinction between primary research and secondary research is essential in determining which research method is best for your project. These are the two main types of research methods, each with advantages and disadvantages. In this section, we will explore the critical differences between the two and when it is appropriate to use them.
| Research is conducted first hand to obtain data. Researcher “owns” the data collected. | Research is based on data collected from previous researches. |
| is based on raw data. | Secondary research is based on tried and tested data which is previously analyzed and filtered. |
| The data collected fits the needs of a researcher, it is customized. Data is collected based on the absolute needs of organizations or businesses. | Data may or may not be according to the requirement of a researcher. |
| Researcher is deeply involved in research to collect data in primary research. | As opposed to primary research, secondary research is fast and easy. It aims at gaining a broader understanding of subject matter. |
| Primary research is an expensive process and consumes a lot of time to collect and analyze data. | Secondary research is a quick process as data is already available. Researcher should know where to explore to get most appropriate data. |
How to Conduct Secondary Research?
We have already learned about the differences between primary and secondary research. Now, let’s take a closer look at how to conduct it.
Secondary research is an important tool for gathering information already collected and analyzed by others. It can help us save time and money and allow us to gain insights into the subject we are researching. So, in this section, we will discuss some common methods and tips for conducting it effectively.
Here are the steps involved in conducting secondary research:
1. Identify the topic of research: Before beginning secondary research, identify the topic that needs research. Once that’s done, list down the research attributes and its purpose.
2. Identify research sources: Next, narrow down on the information sources that will provide most relevant data and information applicable to your research.
3. Collect existing data: Once the data collection sources are narrowed down, check for any previous data that is available which is closely related to the topic. Data related to research can be obtained from various sources like newspapers, public libraries, government and non-government agencies etc.
4. Combine and compare: Once data is collected, combine and compare the data for any duplication and assemble data into a usable format. Make sure to collect data from authentic sources. Incorrect data can hamper research severely.
4. Analyze data: Analyze collected data and identify if all questions are answered. If not, repeat the process if there is a need to dwell further into actionable insights.
Advantages of Secondary Research
Secondary research offers a number of advantages to researchers, including efficiency, the ability to build upon existing knowledge, and the ability to conduct research in situations where primary research may not be possible or ethical. By carefully selecting their sources and being thoughtful in their approach, researchers can leverage secondary research to drive impact and advance the field. Some key advantages are the following:
1. Most information in this research is readily available. There are many sources from which relevant data can be collected and used, unlike primary research, where data needs to collect from scratch.
2. This is a less expensive and less time-consuming process as data required is easily available and doesn’t cost much if extracted from authentic sources. A minimum expenditure is associated to obtain data.
3. The data that is collected through secondary research gives organizations or businesses an idea about the effectiveness of primary research. Hence, organizations or businesses can form a hypothesis and evaluate cost of conducting primary research.
4. Secondary research is quicker to conduct because of the availability of data. It can be completed within a few weeks depending on the objective of businesses or scale of data needed.
As we can see, this research is the process of analyzing data already collected by someone else, and it can offer a number of benefits to researchers.
Disadvantages of Secondary Research
On the other hand, we have some disadvantages that come with doing secondary research. Some of the most notorious are the following:
1. Although data is readily available, credibility evaluation must be performed to understand the authenticity of the information available.
2. Not all secondary data resources offer the latest reports and statistics. Even when the data is accurate, it may not be updated enough to accommodate recent timelines.
3. Secondary research derives its conclusion from collective primary research data. The success of your research will depend, to a greater extent, on the quality of research already conducted by primary research.
LEARN ABOUT: 12 Best Tools for Researchers
In conclusion, secondary research is an important tool for researchers exploring various topics. By leveraging existing data sources, researchers can save time and resources, build upon existing knowledge, and conduct research in situations where primary research may not be feasible.
There are a variety of methods and examples of secondary research, from analyzing public data sets to reviewing previously published research papers. As students and aspiring researchers, it’s important to understand the benefits and limitations of this research and to approach it thoughtfully and critically. By doing so, we can continue to advance our understanding of the world around us and contribute to meaningful research that positively impacts society.
QuestionPro can be a useful tool for conducting secondary research in a variety of ways. You can create online surveys that target a specific population, collecting data that can be analyzed to gain insights into consumer behavior, attitudes, and preferences; analyze existing data sets that you have obtained through other means or benchmark your organization against others in your industry or against industry standards. The software provides a range of benchmarking tools that can help you compare your performance on key metrics, such as customer satisfaction, with that of your peers.
Using QuestionPro thoughtfully and strategically allows you to gain valuable insights to inform decision-making and drive business success. Start today for free! No credit card is required.
LEARN MORE FREE TRIAL
MORE LIKE THIS

Why You Should Attend XDAY 2024
Aug 30, 2024

Alchemer vs Qualtrics: Find out which one you should choose

Target Population: What It Is + Strategies for Targeting
Aug 29, 2024

Microsoft Customer Voice vs QuestionPro: Choosing the Best
Other categories.
- Academic Research
- Artificial Intelligence
- Assessments
- Brand Awareness
- Case Studies
- Communities
- Consumer Insights
- Customer effort score
- Customer Engagement
- Customer Experience
- Customer Loyalty
- Customer Research
- Customer Satisfaction
- Employee Benefits
- Employee Engagement
- Employee Retention
- Friday Five
- General Data Protection Regulation
- Insights Hub
- Life@QuestionPro
- Market Research
- Mobile diaries
- Mobile Surveys
- New Features
- Online Communities
- Question Types
- Questionnaire
- QuestionPro Products
- Release Notes
- Research Tools and Apps
- Revenue at Risk
- Survey Templates
- Training Tips
- Tuesday CX Thoughts (TCXT)
- Uncategorized
- What’s Coming Up
- Workforce Intelligence
- Technical Support
- Technical Papers
- Knowledge Base
- Question Library
Call our friendly, no-pressure support team.
Secondary Research: Definition, Methods, Sources, Examples, and More
Table of Contents
What is Secondary Research? Secondary Research Meaning
Secondary research involves the analysis and synthesis of existing data and information that has been previously collected and published by others. This method contrasts with primary research , which entails the direct collection of original data from sources like surveys, interviews, and ethnographic studies.
The essence of secondary research lies in its efficiency and accessibility. Researchers who leverage secondary sources, including books, scholarly articles, government reports, and market analyses, gather valuable insights without the need for time-consuming and costly data collection efforts. This approach is particularly vital in marketing research, where understanding broad market trends and consumer behaviors is essential, yet often constrained by budgets and timelines. Secondary research serves as a fundamental step in the research process, providing a solid foundation upon which additional, targeted research can be built.
Secondary research enables researchers to quickly grasp the landscape of existing knowledge, identify gaps in the literature, and refine their research questions or business strategies accordingly. In marketing research, for instance, secondary research aids in understanding competitive landscapes, identifying market trends, and benchmarking against industry standards, thereby guiding strategic decision-making.
Get Started with Market Research Today!
Ready for your next market research study? Get access to our free survey research tool. In just a few minutes, you can create powerful surveys with our easy-to-use interface.
Start Market Research for Free or Request a Product Tour
When to Use Secondary Research
Choosing between secondary and primary research methods depends significantly on the objectives of your study or project. Secondary research is particularly beneficial in the initial stages of research planning and strategy, offering a broad understanding of the topic at hand and helping to pinpoint areas that may require more in-depth investigation through primary methods.
In academic contexts, secondary research is often used to build a theoretical foundation for a study, allowing researchers to position their work within the existing body of knowledge. Professionally, it serves as a cost-effective way to inform business strategies, market analyses, and policy development, providing insights into industry trends, consumer behaviors, and competitive landscapes.
Combining secondary research with primary research methods enhances the comprehensiveness and validity of research findings. For example, secondary research might reveal general trends in consumer behavior, while subsequent primary research could delve into specific consumer motivations and preferences, offering a more nuanced understanding of the market.
Key considerations for integrating secondary research into your research planning and strategy include:
- Research Objectives : Clearly defining what you aim to discover or decide based on your research.
- Availability of Data : Assessing the extent and relevance of existing data related to your research question.
- Budget and Time Constraints : Considering the resources available for conducting research, including time, money, and personnel.
- Research Scope : Determining the breadth and depth of the information needed to meet your research objectives.
Secondary research is a powerful tool when used strategically, providing a cost-effective, efficient way to gather insights and inform decision-making processes across academic and professional contexts.
How to Conduct Secondary Research
Conducting secondary research is a systematic process that involves several key steps to ensure the relevance, accuracy, and utility of the information gathered. Here's a step-by-step guide to effective secondary research:
- Identifying Research Objectives, Topics, and Questions : Begin with a clear understanding of what you aim to achieve with your research. This includes defining your research objectives, topics, and specific questions you seek to answer. This clarity guides the entire research process, ensuring that you remain focused on relevant information.
- Finding Relevant Data Sources : Search for secondary data sources that are likely to contain the information you need. This involves exploring a variety of sources such as academic journals, industry reports, government databases, and news archives. Prioritize sources known for their credibility and authority in the subject matter.
- Collecting and Verifying Existing Data : Once you've identified potential sources, collect the data that pertains to your research questions. Pay close attention to the publication date, authorship, and the methodology used in collecting the original data to ensure its relevance and reliability.
- Data Compilation and Analysis : Compile the collected data in a structured format that allows for analysis. Employ analytical methods suited to your research objectives, such as trend analysis, comparative analysis, or thematic analysis, to draw insights from the data.
The success of secondary research hinges on the critical evaluation of sources for their credibility, relevance, and timeliness. It's essential to approach this process with a discerning eye, acknowledging the limitations of secondary data and the potential need for further investigation through primary research.
Types of Secondary Research Methods with Examples
Secondary research methods offer a range of approaches for leveraging existing data, each providing value in extracting insights relevant to various business and academic needs. Understanding the unique advantages of each method can guide researchers in choosing the most appropriate approach for their specific objectives.
Literature Reviews
Literature reviews synthesize existing research and publications to identify trends, gaps, and consensus within a field of study. This method provides a comprehensive overview of what is already known about a topic, saving time and resources by building on existing knowledge rather than starting from scratch.
Real-World Example : A marketing firm conducting a literature review on consumer behavior in the digital age might uncover a trend towards increased mobile shopping. This insight leads to a strategic recommendation for a retail client to prioritize mobile app development and optimize their online store for mobile users, directly impacting the client's digital marketing strategy.
Data Mining
Data mining involves analyzing large sets of data to discover patterns, correlations, or trends that are not immediately apparent. This method can uncover hidden insights from the data that businesses can use to inform decision-making, such as identifying new market opportunities or optimizing operational efficiencies.
Real-World Example : Through data mining of customer purchase histories and online behavior data, a retail company identifies a previously unnoticed correlation between the purchase of certain products and the time of year. Utilizing this insight, the company adjusts its inventory levels and marketing campaigns seasonally, significantly boosting sales and customer satisfaction.
Meta-Analysis
Meta-analysis aggregates and systematically analyzes results from multiple studies to draw general conclusions about a research question. This method provides a high level of evidence by combining findings, offering a powerful tool for making informed decisions based on a broader range of data than any single study could provide.
Real-World Example : A pharmaceutical company uses meta-analysis to combine findings from various clinical trials of a new drug. The meta-analysis reveals a statistically significant benefit of the drug that was not conclusive in individual studies. This insight supports the company's application for regulatory approval and guides the development of marketing strategies targeting specific patient demographics.
Data Analysis
Secondary data analysis applies statistical techniques to analyze existing datasets, offering a cost-effective way to gain insights without the need for new data collection. This method can identify trends, patterns, and relationships that inform strategic planning and decision-making.
Real-World Example : An investment firm analyzes historical economic data and stock market trends using secondary data analysis. They identify a recurring pattern preceding market downturns. By applying this insight to their investment strategy, the firm successfully mitigates risk and enhances portfolio performance for their clients.
Content Analysis
Content analysis systematically examines the content of communication mediums to understand messages, themes, or biases . This qualitative method can reveal insights into public opinion, media representation, and communication strategies, offering valuable information for marketing, public relations, and media strategies.
Real-World Example : A technology company employs content analysis to review online customer reviews and social media mentions of its products. The analysis uncovers a common concern among customers about the usability of a product feature. Responding to this insight, the company revises its product design and launches a targeted communication campaign to address the concerns, improving customer satisfaction and brand perception.
Historical Research
Historical research examines past records and documents to understand historical contexts and trends, offering insights that can inform future predictions, strategy development, and understanding of long-term changes. This method is particularly valuable for understanding the evolution of markets, industries, or consumer behaviors over time.
Real-World Example : A consultancy specializing in sustainable business practices conducts historical research into the adoption of green technologies in the automotive industry. The research identifies key drivers and barriers to adoption over the decades. Leveraging these insights, the consultancy advises new green tech startups on strategies to overcome market resistance and capitalize on drivers of adoption, significantly impacting their market entry strategy.
Each of these secondary research methods provides distinct advantages and can yield valuable insights for businesses and researchers. By carefully selecting and applying the most suitable method(s), organizations can enhance their understanding of complex issues, inform strategic decisions, and achieve competitive advantage.
Free Survey Maker Tool
Get access to our free and intuitive survey maker. In just a few minutes, you can create powerful surveys with its easy-to-use interface.
Try our Free Survey Maker or Request a Product Tour
Examples of Secondary Sources in Research
Secondary sources are crucial for researchers across disciplines, offering a wealth of information that can provide insights, support hypotheses, and inform strategies. Understanding the unique value of different types of secondary sources can help researchers effectively harness this wealth of information. Below, we explore various secondary sources, highlighting their unique contributions and providing real-world examples of how they can yield valuable business insights.
Books provide comprehensive coverage of a topic, offering depth and context that shorter pieces might miss. They are particularly useful for gaining a thorough understanding of a subject's historical background and theoretical framework.
Example : A corporation exploring the feasibility of entering a new international market utilizes books on the country's cultural and economic history. This deep dive helps the company understand market nuances, leading to a tailored market entry strategy that aligns with local consumer preferences and cultural norms.
Scholarly Journals
Scholarly journals offer peer-reviewed, cutting-edge research findings, making them invaluable for staying abreast of the latest developments in a field. They provide detailed methodologies, rigorous data analysis, and discussions of findings in a specific area of study.
Example : An investment firm relies on scholarly articles to understand recent advancements in financial technology. Discovering research on blockchain's impact on transaction security and efficiency, the firm decides to invest in fintech startups specializing in blockchain technology, positioning itself ahead in the market.
Government Reports
Government reports deliver authoritative data on a wide range of topics, including economic indicators, demographic trends, and regulatory guidelines. Their reliability and the breadth of topics covered make them an essential resource for informed decision-making.
Example : A healthcare provider examines government health reports to identify trends in public health issues. Spotting an increase in lifestyle-related diseases, the provider expands its wellness programs, directly addressing the growing demand for preventive care services.
Market Research Reports
Market research reports provide insights into industry trends, consumer behavior, and competitive landscapes. These reports are invaluable for making informed business decisions, from product development to marketing strategies.
Example : A consumer goods company reviews market research reports to analyze trends in eco-friendly packaging. Learning about the positive consumer response to sustainable packaging, the company redesigns its packaging to be more environmentally friendly, resulting in increased brand loyalty and market share.
White Papers
White papers offer in-depth analysis or arguments on specific issues, often highlighting solutions or innovations. They are a key resource for understanding complex problems, technological advancements, and industry best practices.
Example : A technology firm exploring the implementation of AI in customer service operations consults white papers on AI applications. Insights from these papers guide the development of an AI-powered customer service chatbot, enhancing efficiency and customer satisfaction.
Private Company Data
Data from private companies, such as annual reports or case studies, provides insight into business strategies, performance metrics, and operational challenges. This information can be instrumental in benchmarking and strategic planning.
Example : By analyzing competitor annual reports, a retail chain identifies a gap in the market for affordable luxury products. This insight leads to the launch of a new product line that successfully captures this underserved segment, boosting the company's revenue and market positioning.
Advantages and Disadvantages of Secondary Research
Secondary research offers a foundation upon which organizations can build their knowledge base, informing everything from strategic planning to day-to-day decision-making. However, like any method, it comes with its own set of advantages and disadvantages. Understanding these can help researchers and businesses make the most of secondary research while being mindful of its limitations.
Advantages of Secondary Research
- Cost-Effectiveness : Secondary research is often less expensive than primary research, as it involves the analysis of existing data, eliminating the need for costly data collection processes like surveys or experiments.
- Time Efficiency : Accessing and analyzing existing data is generally faster than conducting primary research, allowing organizations to make timely decisions based on available information.
- Broad Scope of Data : Secondary research provides access to a wide range of data across different geographies and time periods, enabling comprehensive market analyses and trend identification.
- Basis for Primary Research : It can serve as a preliminary step to identify gaps in existing research, helping to pinpoint areas where primary research is needed.
Disadvantages of Secondary Research
- Relevance and Specificity : Existing data may not perfectly align with the current research objectives, leading to potential mismatches in relevance and specificity.
- Data Quality and Accuracy : The quality and accuracy of secondary data can vary, depending on the source. Researchers must critically assess the credibility of their sources to ensure the reliability of their findings.
- Timeliness : Data may be outdated, especially in fast-moving sectors where recent information is crucial for making informed decisions.
- Limited Control Over Data : Researchers have no control over how data was collected and processed, which may affect its suitability for their specific research needs.
Secondary research, when approached with an understanding of its strengths and weaknesses, has the potential be a powerful tool. By effectively navigating its advantages and limitations, businesses can lay a solid foundation for informed decision-making and strategic planning.
Primary vs. Secondary Research: A Comparative Analysis
When undertaking a research project, understanding the distinction between primary and secondary research is pivotal. Both forms of research serve their own purposes and can complement each other in providing a comprehensive overview of a given topic.
What is Primary Research?
Primary research involves the collection of original data directly from sources. This method is firsthand and is specific to the researcher's questions or hypotheses.
The main advantage of primary research is its specificity and relevancy to the particular issue or question at hand. It offers up-to-date and highly relevant data that is directly applicable to the research objectives.
Example : A company planning to launch a new beverage product conducts focus groups and survey research to understand consumer preferences. Through this process, they gather firsthand insights on flavors, packaging, and pricing preferences specific to their target market.
What is Secondary Research?
Secondary research involves the analysis of existing information compiled and collected by others. It includes studies, reports, and data from government agencies, trade associations, and other organizations.
Secondary research provides a broad understanding of the topic at hand, offering insights that can help frame primary research. It is cost-effective and time-saving, as it leverages already available data.
Example : The same company explores industry reports, academic research, and market analyses to understand broader market trends, competitor strategies, and consumer behavior within the beverage industry.
Comparative Analysis
|
|
|
|
| Data Type | Original, firsthand data | Pre-existing, compiled data |
| Collection Method | Surveys, interviews, observations | Analysis of existing sources |
| Cost and Time | Higher cost, more time-consuming | Lower cost, less time-consuming |
| Specificity | High specificity to research question | General overview of the topic |
| Application | In-depth analysis of specific issues | Preliminary understanding, context setting |
Synergistic Use in Research
The most effective research strategies often involve a blend of both primary and secondary research. Secondary research can serve as a foundation, helping to inform the development of primary research by identifying gaps in existing knowledge and refining research questions.
Understanding the distinct roles and benefits of primary and secondary research is crucial for any successful research project. By effectively leveraging both types of research, researchers can gain a deeper, more nuanced understanding of their subject matter, leading to more informed decisions and strategies. Remember, the choice between primary and secondary research should be guided by your research objectives, resources, and the specificity of information required.
Sawtooth Software
3210 N Canyon Rd Ste 202
Provo UT 84604-6508
United States of America
Support: [email protected]
Consulting: [email protected]
Sales: [email protected]
Products & Services
Support & Resources
What is Secondary Research? Types, Methods, Examples
Appinio Research · 20.09.2023 · 13min read

Have you ever wondered how researchers gather valuable insights without conducting new experiments or surveys? That's where secondary research steps in—a powerful approach that allows us to explore existing data and information others collect.
Whether you're a student, a professional, or someone seeking to make informed decisions, understanding the art of secondary research opens doors to a wealth of knowledge.
What is Secondary Research?
Secondary Research refers to the process of gathering and analyzing existing data, information, and knowledge that has been previously collected and compiled by others. This approach allows researchers to leverage available sources, such as articles, reports, and databases, to gain insights, validate hypotheses, and make informed decisions without collecting new data.
Benefits of Secondary Research
Secondary research offers a range of advantages that can significantly enhance your research process and the quality of your findings.
- Time and Cost Efficiency: Secondary research saves time and resources by utilizing existing data sources, eliminating the need for data collection from scratch.
- Wide Range of Data: Secondary research provides access to vast information from various sources, allowing for comprehensive analysis.
- Historical Perspective: Examining past research helps identify trends, changes, and long-term patterns that might not be immediately apparent.
- Reduced Bias: As data is collected by others, there's often less inherent bias than in conducting primary research, where biases might affect data collection.
- Support for Primary Research: Secondary research can lay the foundation for primary research by providing context and insights into gaps in existing knowledge.
- Comparative Analysis : By integrating data from multiple sources, you can conduct robust comparative analyses for more accurate conclusions.
- Benchmarking and Validation: Secondary research aids in benchmarking performance against industry standards and validating hypotheses.
Primary Research vs. Secondary Research
When it comes to research methodologies, primary and secondary research each have their distinct characteristics and advantages. Here's a brief comparison to help you understand the differences.

Primary Research
- Data Source: Involves collecting new data directly from original sources.
- Data Collection: Researchers design and conduct surveys, interviews, experiments, or observations.
- Time and Resources: Typically requires more time, effort, and resources due to data collection.
- Fresh Insights: Provides firsthand, up-to-date information tailored to specific research questions.
- Control: Researchers control the data collection process and can shape methodologies.
Secondary Research
- Data Source: Involves utilizing existing data and information collected by others.
- Data Collection: Researchers search, select, and analyze data from published sources, reports, and databases.
- Time and Resources: Generally more time-efficient and cost-effective as data is already available.
- Existing Knowledge: Utilizes data that has been previously compiled, often providing broader context.
- Less Control: Researchers have limited control over how data was collected originally, if any.
Choosing between primary and secondary research depends on your research objectives, available resources, and the depth of insights you require.
Types of Secondary Research
Secondary research encompasses various types of existing data sources that can provide valuable insights for your research endeavors. Understanding these types can help you choose the most relevant sources for your objectives.
Here are the primary types of secondary research:
Internal Sources
Internal sources consist of data generated within your organization or entity. These sources provide valuable insights into your own operations and performance.
- Company Records and Data: Internal reports, documents, and databases that house information about sales, operations, and customer interactions.
- Sales Reports and Customer Data: Analysis of past sales trends, customer demographics, and purchasing behavior.
- Financial Statements and Annual Reports: Financial data, such as balance sheets and income statements, offer insights into the organization's financial health.
External Sources
External sources encompass data collected and published by entities outside your organization.
These sources offer a broader perspective on various subjects.
- Published Literature and Journals: Scholarly articles, research papers, and academic studies available in journals or online databases.
- Market Research Reports: Reports from market research firms that provide insights into industry trends, consumer behavior, and market forecasts.
- Government and NGO Databases: Data collected and maintained by government agencies and non-governmental organizations, offering demographic, economic, and social information.
- Online Media and News Articles: News outlets and online publications that cover current events, trends, and societal developments.
Each type of secondary research source holds its value and relevance, depending on the nature of your research objectives. Combining these sources lets you understand the subject matter and make informed decisions.
How to Conduct Secondary Research?
Effective secondary research involves a thoughtful and systematic approach that enables you to extract valuable insights from existing data sources. Here's a step-by-step guide on how to navigate the process:
1. Define Your Research Objectives
Before delving into secondary research, clearly define what you aim to achieve. Identify the specific questions you want to answer, the insights you're seeking, and the scope of your research.
2. Identify Relevant Sources
Begin by identifying the most appropriate sources for your research. Consider the nature of your research objectives and the data type you require. Seek out sources such as academic journals, market research reports, official government databases, and reputable news outlets.
3. Evaluate Source Credibility
Ensuring the credibility of your sources is crucial. Evaluate the reliability of each source by assessing factors such as the author's expertise, the publication's reputation, and the objectivity of the information provided. Choose sources that align with your research goals and are free from bias.
4. Extract and Analyze Information
Once you've gathered your sources, carefully extract the relevant information. Take thorough notes, capturing key data points, insights, and any supporting evidence. As you accumulate information, start identifying patterns, trends, and connections across different sources.
5. Synthesize Findings
As you analyze the data, synthesize your findings to draw meaningful conclusions. Compare and contrast information from various sources to identify common themes and discrepancies. This synthesis process allows you to construct a coherent narrative that addresses your research objectives.
6. Address Limitations and Gaps
Acknowledge the limitations and potential gaps in your secondary research. Recognize that secondary data might have inherent biases or be outdated. Where necessary, address these limitations by cross-referencing information or finding additional sources to fill in gaps.
7. Contextualize Your Findings
Contextualization is crucial in deriving actionable insights from your secondary research. Consider the broader context within which the data was collected. How does the information relate to current trends, societal changes, or industry shifts? This contextual understanding enhances the relevance and applicability of your findings.
8. Cite Your Sources
Maintain academic integrity by properly citing the sources you've used for your secondary research. Accurate citations not only give credit to the original authors but also provide a clear trail for readers to access the information themselves.
9. Integrate Secondary and Primary Research (If Applicable)
In some cases, combining secondary and primary research can yield more robust insights. If you've also conducted primary research, consider integrating your secondary findings with your primary data to provide a well-rounded perspective on your research topic.
You can use a market research platform like Appinio to conduct primary research with real-time insights in minutes!
10. Communicate Your Findings
Finally, communicate your findings effectively. Whether it's in an academic paper, a business report, or any other format, present your insights clearly and concisely. Provide context for your conclusions and use visual aids like charts and graphs to enhance understanding.
Remember that conducting secondary research is not just about gathering information—it's about critically analyzing, interpreting, and deriving valuable insights from existing data. By following these steps, you'll navigate the process successfully and contribute to the body of knowledge in your field.
Secondary Research Examples
To better understand how secondary research is applied in various contexts, let's explore a few real-world examples that showcase its versatility and value.
Market Analysis and Trend Forecasting
Imagine you're a marketing strategist tasked with launching a new product in the smartphone industry. By conducting secondary research, you can:
- Access Market Reports: Utilize market research reports to understand consumer preferences, competitive landscape, and growth projections.
- Analyze Trends: Examine past sales data and industry reports to identify trends in smartphone features, design, and user preferences.
- Benchmark Competitors: Compare market share, customer satisfaction , and pricing strategies of key competitors to develop a strategic advantage.
- Forecast Demand: Use historical sales data and market growth predictions to estimate demand for your new product.
Academic Research and Literature Reviews
Suppose you're a student researching climate change's effects on marine ecosystems. Secondary research aids your academic endeavors by:
- Reviewing Existing Studies: Analyze peer-reviewed articles and scientific papers to understand the current state of knowledge on the topic.
- Identifying Knowledge Gaps: Identify areas where further research is needed based on what existing studies still need to cover.
- Comparing Methodologies: Compare research methodologies used by different studies to assess the strengths and limitations of their approaches.
- Synthesizing Insights: Synthesize findings from various studies to form a comprehensive overview of the topic's implications on marine life.
Competitive Landscape Assessment for Business Strategy
Consider you're a business owner looking to expand your restaurant chain to a new location. Secondary research aids your strategic decision-making by:
- Analyzing Demographics: Utilize demographic data from government databases to understand the local population's age, income, and preferences.
- Studying Local Trends: Examine restaurant industry reports to identify the types of cuisines and dining experiences currently popular in the area.
- Understanding Consumer Behavior: Analyze online reviews and social media discussions to gauge customer sentiment towards existing restaurants in the vicinity.
- Assessing Economic Conditions: Access economic reports to evaluate the local economy's stability and potential purchasing power.
These examples illustrate the practical applications of secondary research across various fields to provide a foundation for informed decision-making, deeper understanding, and innovation.
Secondary Research Limitations
While secondary research offers many benefits, it's essential to be aware of its limitations to ensure the validity and reliability of your findings.
- Data Quality and Validity: The accuracy and reliability of secondary data can vary, affecting the credibility of your research.
- Limited Contextual Information: Secondary sources might lack detailed contextual information, making it important to interpret findings within the appropriate context.
- Data Suitability: Existing data might not align perfectly with your research objectives, leading to compromises or incomplete insights.
- Outdated Information: Some sources might provide obsolete information that doesn't accurately reflect current trends or situations.
- Potential Bias: While secondary data is often less biased, biases might still exist in the original data sources, influencing your findings.
- Incompatibility of Data: Combining data from different sources might pose challenges due to variations in definitions, methodologies, or units of measurement.
- Lack of Control: Unlike primary research, you have no control over how data was collected or its quality, potentially affecting your analysis. Understanding these limitations will help you navigate secondary research effectively and make informed decisions based on a well-rounded understanding of its strengths and weaknesses.
Secondary research is a valuable tool that businesses can use to their advantage. By tapping into existing data and insights, companies can save time, resources, and effort that would otherwise be spent on primary research. This approach equips decision-makers with a broader understanding of market trends, consumer behaviors, and competitive landscapes. Additionally, benchmarking against industry standards and validating hypotheses empowers businesses to make informed choices that lead to growth and success.
As you navigate the world of secondary research, remember that it's not just about data retrieval—it's about strategic utilization. With a clear grasp of how to access, analyze, and interpret existing information, businesses can stay ahead of the curve, adapt to changing landscapes, and make decisions that are grounded in reliable knowledge.
How to Conduct Secondary Research in Minutes?
In the world of decision-making, having access to real-time consumer insights is no longer a luxury—it's a necessity. That's where Appinio comes in, revolutionizing how businesses gather valuable data for better decision-making. As a real-time market research platform, Appinio empowers companies to tap into the pulse of consumer opinions swiftly and seamlessly.
- Fast Insights: Say goodbye to lengthy research processes. With Appinio, you can transform questions into actionable insights in minutes.
- Data-Driven Decisions: Harness the power of real-time consumer insights to drive your business strategies, allowing you to make informed choices on the fly.
- Seamless Integration: Appinio handles the research and technical complexities, freeing you to focus on what truly matters: making rapid data-driven decisions that propel your business forward.
Join the loop 💌
Be the first to hear about new updates, product news, and data insights. We'll send it all straight to your inbox.
Get the latest market research news straight to your inbox! 💌
Wait, there's more

27.08.2024 | 34min read
What is Brand Architecture? Models, Strategy, Examples

22.08.2024 | 32min read
What is Voice of the Customer (VoC)? Program, Examples

20.08.2024 | 31min read
What is Employee Experience (EX) and How to Improve It?
What is secondary research?
Last updated
7 February 2023
Reviewed by
Cathy Heath
In this guide, we explain in detail what secondary research is, including the difference between this research method and primary research, the different sources for secondary research, and how you can benefit from this research method.
Analyze your secondary research
Bring your secondary research together inside Dovetail, tag PDFs, and uncover actionable insights
- Overview of secondary research
Secondary research is a method by which the researcher finds existing data, filters it to meet the context of their research question, analyzes it, and then summarizes it to come up with valid research conclusions.
This research method involves searching for information, often via the internet, using keywords or search terms relevant to the research question. The goal is to find data from internal and external sources that are up-to-date and authoritative, and that fully answer the question.
Secondary research reviews existing research and looks for patterns, trends, and insights, which helps determine what further research, if any, is needed.
- Secondary research methods
Secondary research is more economical than primary research, mainly because the methods for this type of research use existing data and do not require the data to be collected first-hand or by a third party that you have to pay.
Secondary research is referred to as ‘desk research’ or ‘desktop research,’ since the data can be retrieved from behind a desk instead of having to host a focus group and create the research from scratch.
Finding existing research is relatively easy since there are numerous accessible sources organizations can use to obtain the information they need. These include:
The internet: This data is either free or behind a paywall. Yet, while there are plenty of sites on the internet with information that can be used, businesses need to be careful to collect information from trusted and authentic websites to ensure the data is accurate.
Government agencies: Government agencies are typically known to provide valuable, trustworthy information that companies can use for their research.
The public library: This establishment holds paper-based and online sources of reliable information, including business databases, magazines, newspapers, and government publications. Be mindful of any copyright restrictions that may apply when using these sources.
Commercial information: This source provides first-hand information on politics, demographics, and economic developments through information aggregators, newspapers, magazines, radio, blogs, podcasts, and journals. This information may be free or behind a paywall.
Educational and scientific facilities: Universities, colleges, and specialized research facilities carry out significant amounts of research. As a result, they have data that may be available to the public and businesses for use.
- Key differences between primary research and secondary research
Both primary and secondary research methods provide researchers with vital, complementary information, despite some major differences between the two approaches.
Primary research involves gathering first-hand information by directly working with the target market, users, and interviewees. Researchers ask questions directly using surveys , interviews, and focus groups.
Through the primary research method, researchers obtain targeted responses and accurate results directly related to their overall research goals.
Secondary research uses existing data, such as published reports, that have already been completed through earlier primary and secondary research. Researchers can use this existing data to support their research goals and preliminary research findings.
Other notable differences between primary and secondary research include:
Relevance: Primary research uses raw data relevant to the investigation's goals. Secondary research may contain irrelevant data or may not neatly fit the parameters of the researcher's goals.
Time: Primary research takes a lot of time. Secondary research can be done relatively quickly.
Researcher bias: Primary research can be subject to researcher bias.
Cost: Primary research can be expensive. Secondary research can be more affordable because the data is often free. However, valuable data is often behind a paywall. The piece of secondary research you want may not exist or be very expensive, so you may have to turn to primary research to fill the information gap.
- When to conduct secondary research
Both primary and secondary research have roles to play in providing a holistic and accurate understanding of a topic. Generally, secondary research is done at the beginning of the research phase, especially if the topic is new.
Secondary research can provide context and critical background information to understand the issue at hand and identify any gaps, that could then be filled by primary research.
- How to conduct secondary research
Researchers usually follow several steps for secondary research.
1. Identify and define the research topic
Before starting either of these research methods, you first need to determine the following:
Topic to be researched
Purpose of this research
For instance, you may want to explore a question, determine why something happened, or confirm whether an issue is true.
At this stage, you also need to consider what search terms or keywords might be the most effective for this topic. You could do this by looking at what synonyms exist for your topic, the use of industry terms and acronyms, as well as the balance between statistical or quantitative data and contextual data to support your research topic.
It’s also essential to define what you don’t want to cover in your secondary research process. This might be choosing only to use recent information or only focusing on research based on a particular country or type of consumer. From there, once you know what you want to know and why you can decide whether you need to use both primary and secondary research to answer your questions.
2. Find research and existing data sources
Once you have determined your research topic , select the information sources that will provide you with the most appropriate and relevant data for your research. If you need secondary research, you want to determine where this information can likely be found, for example:
Trade associations
Government sources
Create a list of the relevant data sources , and other organizations or people that can help you find what you need.
3. Begin searching and collecting the existing data
Once you have narrowed down your sources, you will start gathering this information and putting it into an organized system. This often involves:
Checking the credibility of the source
Setting up meetings with research teams
Signing up for accounts to access certain websites or journals
One search result on the internet often leads to other pieces of helpful information, known as ‘pearl gathering’ or ‘pearl harvesting.’ This is usually a serendipitous activity, which can lead to valuable nuggets of information you may not have been aware of or considered.
4. Combine the data and compare the results
Once you have gathered all the data, start going through it by carefully examining all the information and comparing it to ensure the data is usable and that it isn’t duplicated or corrupted. Contradictory information is useful—just make sure you note the contradiction and the context. Be mindful of copyright and plagiarism when using secondary research and always cite your sources.
Once you have assessed everything, you will begin to look at what this information tells you by checking out the trends and comparing the different datasets. You will also investigate what this information means for your research, whether it helps your overall goal, and any gaps or deficiencies.
5. Analyze your data and explore further
In the final stage of conducting secondary research, you will analyze the data you have gathered and determine if it answers the questions you had before you started researching. Check that you understand the information, whether it fills in all your gaps, and whether it provides you with other insights or actions you should take next.
If you still need further data, repeat these steps to find additional information that can help you explore your topic more deeply. You may also need to supplement what you find with primary research to ensure that your data is complete, accurate, transparent, and credible.
- The advantages of secondary research
There are numerous advantages to performing secondary research. Some key benefits are:
Quicker than primary research: Because the data is already available, you can usually find the information you need fairly quickly. Not only will secondary research help you research faster, but you will also start optimizing the data more quickly.
Plenty of available data: There are countless sources for you to choose from, making research more accessible. This data may be already compiled and arranged, such as statistical information, so you can quickly make use of it.
Lower costs: Since you will not have to carry out the research from scratch, secondary research tends to be much more affordable than primary research.
Opens doors to further research: Existing research usually identifies whether more research needs to be done. This could mean follow-up surveys or telephone interviews with subject matter experts (SME) to add value to your own research.
- The disadvantages of secondary research
While there are plenty of benefits to secondary research are plenty, there are some issues you should be aware of. These include:
Credibility issues: It is important to verify the sources used. Some information may be biased and not reflect or hide, relevant issues or challenges. It could also be inaccurate.
No recent information: Even if data may seem accurate, it may not be up to date, so the information you gather may no longer be correct. Outdated research can distort your overall findings.
Poor quality: Because secondary research tends to make conclusions from primary research data, the success of secondary research will depend on the quality and context of the research that has already been completed. If the research you are using is of poor quality, this will bring down the quality of your own findings.
Research doesn’t exist or is not easily accessible, or is expensive: Sometimes the information you need is confidential or proprietary, such as sales or earnings figures. Many information-based businesses attach value to the information they hold or publish, so the costs to access this information can be prohibitive.
Should you complete secondary research or primary research first?
Due to the costs and time involved in primary research, it may be more beneficial to conduct secondary market research first. This will save you time and provide a picture of what issues you may come across in your research. This allows you to focus on using more expensive primary research to get the specific answers you want.
What should you ask yourself before using secondary research data?
Check the date of the research to make sure it is still relevant. Also, determine the data source so you can assess how credible and trustworthy it is likely to be. For example, data from known brands, professional organizations, and even government agencies are usually excellent sources to use in your secondary research, as it tends to be trustworthy.
Be careful when using some websites and personal blogs as they may be based on opinions rather than facts. However, these sources can be useful for determining sentiment about a product or service, and help direct any primary research.
Should you be using a customer insights hub?
Do you want to discover previous research faster?
Do you share your research findings with others?
Do you analyze research data?
Start for free today, add your research, and get to key insights faster
Editor’s picks
Last updated: 18 April 2023
Last updated: 27 February 2023
Last updated: 22 August 2024
Last updated: 5 February 2023
Last updated: 16 August 2024
Last updated: 9 March 2023
Last updated: 30 April 2024
Last updated: 12 December 2023
Last updated: 11 March 2024
Last updated: 4 July 2024
Last updated: 6 March 2024
Last updated: 5 March 2024
Last updated: 13 May 2024
Latest articles
Related topics, .css-je19u9{-webkit-align-items:flex-end;-webkit-box-align:flex-end;-ms-flex-align:flex-end;align-items:flex-end;display:-webkit-box;display:-webkit-flex;display:-ms-flexbox;display:flex;-webkit-flex-direction:row;-ms-flex-direction:row;flex-direction:row;-webkit-box-flex-wrap:wrap;-webkit-flex-wrap:wrap;-ms-flex-wrap:wrap;flex-wrap:wrap;-webkit-box-pack:center;-ms-flex-pack:center;-webkit-justify-content:center;justify-content:center;row-gap:0;text-align:center;max-width:671px;}@media (max-width: 1079px){.css-je19u9{max-width:400px;}.css-je19u9>span{white-space:pre;}}@media (max-width: 799px){.css-je19u9{max-width:400px;}.css-je19u9>span{white-space:pre;}} decide what to .css-1kiodld{max-height:56px;display:-webkit-box;display:-webkit-flex;display:-ms-flexbox;display:flex;-webkit-align-items:center;-webkit-box-align:center;-ms-flex-align:center;align-items:center;}@media (max-width: 1079px){.css-1kiodld{display:none;}} build next, decide what to build next, log in or sign up.
Get started for free

Secondary Research Guide: Definition, Methods, Examples
Apr 3, 2024
8 min. read
The internet has vastly expanded our access to information, allowing us to learn almost anything about everything. But not all market research is created equal , and this secondary research guide explains why.
There are two key ways to do research. One is to test your own ideas, make your own observations, and collect your own data to derive conclusions. The other is to use secondary research — where someone else has done most of the heavy lifting for you.
Here’s an overview of secondary research and the value it brings to data-driven businesses.
Secondary Research Definition: What Is Secondary Research?
Primary vs Secondary Market Research
What Are Secondary Research Methods?
Advantages of secondary research, disadvantages of secondary research, best practices for secondary research, how to conduct secondary research with meltwater.
Secondary research definition: The process of collecting information from existing sources and data that have already been analyzed by others.
Secondary research (aka desk research or complementary research ) provides a foundation to help you understand a topic, with the goal of building on existing knowledge. They often cover the same information as primary sources, but they add a layer of analysis and explanation to them.

Users can choose from several secondary research types and sources, including:
- Journal articles
- Research papers
With secondary sources, users can draw insights, detect trends , and validate findings to jumpstart their research efforts.
Primary vs. Secondary Market Research
We’ve touched a little on primary research , but it’s essential to understand exactly how primary and secondary research are unique.

Think of primary research as the “thing” itself, and secondary research as the analysis of the “thing,” like these primary and secondary research examples:
- An expert gives an interview (primary research) and a marketer uses that interview to write an article (secondary research).
- A company conducts a consumer satisfaction survey (primary research) and a business analyst uses the survey data to write a market trend report (secondary research).
- A marketing team launches a new advertising campaign across various platforms (primary research) and a marketing research firm, like Meltwater for market research , compiles the campaign performance data to benchmark against industry standards (secondary research).
In other words, primary sources make original contributions to a topic or issue, while secondary sources analyze, synthesize, or interpret primary sources.
Both are necessary when optimizing a business, gaining a competitive edge , improving marketing, or understanding consumer trends that may impact your business.
Secondary research methods focus on analyzing existing data rather than collecting primary data . Common examples of secondary research methods include:
- Literature review . Researchers analyze and synthesize existing literature (e.g., white papers, research papers, articles) to find knowledge gaps and build on current findings.
- Content analysis . Researchers review media sources and published content to find meaningful patterns and trends.
- AI-powered secondary research . Platforms like Meltwater for market research analyze vast amounts of complex data and use AI technologies like natural language processing and machine learning to turn data into contextual insights.
Researchers today have access to more secondary research companies and market research tools and technology than ever before, allowing them to streamline their efforts and improve their findings.
Want to see how Meltwater can complement your secondary market research efforts? Simply fill out the form at the bottom of this post, and we'll be in touch.
Conducting secondary research offers benefits in every job function and use case, from marketing to the C-suite. Here are a few advantages you can expect.
Cost and time efficiency
Using existing research saves you time and money compared to conducting primary research. Secondary data is readily available and easily accessible via libraries, free publications, or the Internet. This is particularly advantageous when you face time constraints or when a project requires a large amount of data and research.
Access to large datasets
Secondary data gives you access to larger data sets and sample sizes compared to what primary methods may produce. Larger sample sizes can improve the statistical power of the study and add more credibility to your findings.
Ability to analyze trends and patterns
Using larger sample sizes, researchers have more opportunities to find and analyze trends and patterns. The more data that supports a trend or pattern, the more trustworthy the trend becomes and the more useful for making decisions.
Historical context
Using a combination of older and recent data allows researchers to gain historical context about patterns and trends. Learning what’s happened before can help decision-makers gain a better current understanding and improve how they approach a problem or project.
Basis for further research
Ideally, you’ll use secondary research to further other efforts . Secondary sources help to identify knowledge gaps, highlight areas for improvement, or conduct deeper investigations.
Tip: Learn how to use Meltwater as a research tool and how Meltwater uses AI.
Secondary research comes with a few drawbacks, though these aren’t necessarily deal breakers when deciding to use secondary sources.
Reliability concerns
Researchers don’t always know where the data comes from or how it’s collected, which can lead to reliability concerns. They don’t control the initial process, nor do they always know the original purpose for collecting the data, both of which can lead to skewed results.
Potential bias
The original data collectors may have a specific agenda when doing their primary research, which may lead to biased findings. Evaluating the credibility and integrity of secondary data sources can prove difficult.
Outdated information
Secondary sources may contain outdated information, especially when dealing with rapidly evolving trends or fields. Using outdated information can lead to inaccurate conclusions and widen knowledge gaps.
Limitations in customization
Relying on secondary data means being at the mercy of what’s already published. It doesn’t consider your specific use cases, which limits you as to how you can customize and use the data.
A lack of relevance
Secondary research rarely holds all the answers you need, at least from a single source. You typically need multiple secondary sources to piece together a narrative, and even then you might not find the specific information you need.
| Advantages of Secondary Research | Disadvantages of Secondary Research |
|---|---|
| Cost and time efficiency | Reliability concerns |
| Access to large data sets | Potential bias |
| Ability to analyze trends and patterns | Outdated information |
| Historical context | Limitations in customization |
| Basis for further research | A lack of relevance |
To make secondary market research your new best friend, you’ll need to think critically about its strengths and find ways to overcome its weaknesses. Let’s review some best practices to use secondary research to its fullest potential.
Identify credible sources for secondary research
To overcome the challenges of bias, accuracy, and reliability, choose secondary sources that have a demonstrated history of excellence . For example, an article published in a medical journal naturally has more credibility than a blog post on a little-known website.

Assess credibility based on peer reviews, author expertise, sampling techniques, publication reputation, and data collection methodologies. Cross-reference the data with other sources to gain a general consensus of truth.
The more credibility “factors” a source has, the more confidently you can rely on it.
Evaluate the quality and relevance of secondary data
You can gauge the quality of the data by asking simple questions:
- How complete is the data?
- How old is the data?
- Is this data relevant to my needs?
- Does the data come from a known, trustworthy source?
It’s best to focus on data that aligns with your research objectives. Knowing the questions you want to answer and the outcomes you want to achieve ahead of time helps you focus only on data that offers meaningful insights.
Document your sources
If you’re sharing secondary data with others, it’s essential to document your sources to gain others’ trust. They don’t have the benefit of being “in the trenches” with you during your research, and sharing your sources can add credibility to your findings and gain instant buy-in.
Secondary market research offers an efficient, cost-effective way to learn more about a topic or trend, providing a comprehensive understanding of the customer journey . Compared to primary research, users can gain broader insights, analyze trends and patterns, and gain a solid foundation for further exploration by using secondary sources.
Meltwater for market research speeds up the time to value in using secondary research with AI-powered insights, enhancing your understanding of the customer journey. Using natural language processing, machine learning, and trusted data science processes, Meltwater helps you find relevant data and automatically surfaces insights to help you understand its significance. Our solution identifies hidden connections between data points you might not know to look for and spells out what the data means, allowing you to make better decisions based on accurate conclusions. Learn more about Meltwater's power as a secondary research solution when you request a demo by filling out the form below:
Continue Reading

How To Do Market Research: Definition, Types, Methods

What Are Consumer Insights? Meaning, Examples, Strategy

Market Intelligence 101: What It Is & How To Use It

The 13 Best Market Research Tools in 2024

Consumer Intelligence: Definition & Examples

9 Top Consumer Insights Tools & Companies

What Is Desk Research? Meaning, Methodology, Examples

Top Secondary Market Research Companies | Desk Research Companies

Want to create or adapt books like this? Learn more about how Pressbooks supports open publishing practices.
4 Chapter 5 Secondary Research
Learning Objectives
By the end of this chapter, students must be able to:
- Explain the concept of secondary research
- Highlight the key benefits and limitations of secondary research
- Evaluate different sources of secondary data
What is Secondary Research?
In situations where the researcher has not been involved in the data gathering process (primary research), one may have to rely on existing information and data to arrive at specific research conclusions or outcomes. Secondary research, also known as desk research, is a research method that involves the use of information previously collected for another research purpose.
In this chapter, we are going to explain what secondary research is, how it works, and share some examples of it in practice.
Marketing textbook © 2022 Western Sydney University taken by Sally Tsoutas Western Sydney University Photographer is licensed under an Attribution-NonCommercial-NoDerivatives 4.0 International
Sources of secondary data.
The two main sources of secondary data are:
- Internal sources
- External sources
Internal sources of secondary data exist within the organization. There could be reports, previous research findings, or old documents which may still be used to understand a particular phenomenon. This information may only be available to the organization’s members and could be a valuable asset.
External sources of secondary data lie outside the organization and refer to information held at the public library, government departments, council offices, various associations as well as in newspapers or journal articles.
Benefits of using Secondary Data
It is only logical for researchers to look for secondary information thoroughly before investing their time and resources in collecting primary data. In academic research, scholars are not permitted to move to the next stage till they demonstrate they have undertaken a review of all previous studies. Suppose a researcher would like to examine the characteristics of a migrant population in the Western Sydney region. The following pieces of information are already available in various reports generated from the Australian Bureau of Statistics’ census data:
- Birthplace of residents
- Language spoken at home by residents
- Family size
- Income levels
- Level of education
By accessing such readily available secondary data, the researcher is able to save time, money, and effort. When the data comes from a reputable source, it further adds to the researchers’ credibility of identifying a trustworthy source of information.
Evaluation of Secondary Data
[1] Assessing secondary data is important. It may not always be available free of cost. The following factors must be considered as these relate to the reliability and validity of research results, such as whether:
- the source is trusted
- the sample characteristics, time of collection, and response rate (if relevant) of the data are appropriate
- the methods of data collection are appropriate and acceptable in your discipline
- the data were collected in a consistent way
- any data coding or modification is appropriate and sufficient
- the documentation of the original study in which the data were collected is detailed enough for you to assess its quality
- there is enough information in the metadata or data to properly cite the original source.
In addition to the above-mentioned points, some practical issues which need to be evaluated include the cost of accessing and the time frame involved in getting access to the data is relevant.

The infographic Secondary Sources created by Shonn M. Haren, 2015 is licensed under a Creative Commons Attribution 4.0 International Licence [2]
Table 2: differences between primary and secondary research.
| First-hand research to collect data. May require a lot of time | The research collects existing, published data. Requires less time |
| Creates raw data that the researcher owns | The researcher has no control over data method or ownership |
| Relevant to the goals of the research | May not be relevant to the goals of the research |
| The researcher conducts research. May be subject to researcher bias | The researcher only uses findings of the research |
| Can be expensive to carry out | More affordable due to access to free data (sometimes!) |
- Griffith University n.d., Research data: get started, viewed 28 February 2022,<https://libraryguides.griffith.edu.au/finddata>. ↵
- Shonnmaren n.d., Secondary sources, viewed 28 February 2020, Wikimedia Commons, <https://commons.wikimedia.org/wiki/File:Secondary_Sources.png> ↵
- Qualtrics XM n.d., S econdary research: definition, methods and examples , viewed 28 February 2022, <https://www.qualtrics.com/au/experience-management/research/secondary-research/#:~:text=Unlike%20primary%20research%2C%20secondary%20research,secondary%20research%20have%20their%20places>. ↵
About the author

name: Aila Khan
institution: Western Sydney University
Chapter 5 Secondary Research Copyright © by Aila Khan is licensed under a Creative Commons Attribution-NonCommercial-ShareAlike 4.0 International License , except where otherwise noted.
Share This Book

An official website of the United States government
The .gov means it’s official. Federal government websites often end in .gov or .mil. Before sharing sensitive information, make sure you’re on a federal government site.
The site is secure. The https:// ensures that you are connecting to the official website and that any information you provide is encrypted and transmitted securely.
- Publications
- Account settings
Preview improvements coming to the PMC website in October 2024. Learn More or Try it out now .
- Advanced Search
- Journal List
- J Adv Pract Oncol
- v.10(4); May-Jun 2019
Secondary Analysis Research
In secondary data analysis (SDA) studies, investigators use data collected by other researchers to address different questions. Like primary data researchers, SDA investigators must be knowledgeable about their research area to identify datasets that are a good fit for an SDA. Several sources of datasets may be useful for SDA, and examples of some of these will be discussed. Advanced practice providers must be aware of possible advantages, such as economic savings, the ability to examine clinically significant research questions in large datasets that may have been collected over time (longitudinal data), generating new hypotheses or clarifying research questions, and avoiding overburdening sensitive populations or investigating sensitive areas. When reading an SDA report, the reader should be able to determine that the authors identified the limitation or disadvantages of their research. For example, a primary dataset cannot “fit” an SDA researcher’s study exactly, SDAs are inherently limited by the inability to definitively examine causality given their retrospective nature, and data may be too old to address current issues.
Secondary analysis of data collected by another researcher for a different purpose, or SDA, is increasing in the medical and social sciences. This is not surprising, given the immense body of health care–related research performed worldwide and the potential beneficial clinical implications of the timely expansion of primary research ( Johnston, 2014 ; Tripathy, 2013 ). Oncology advanced practitioners should understand why and how SDA studies are done, their potential advantages and disadvantages, as well as the importance of reading primary and secondary analysis research reports with the same discriminatory, evaluative eye for possible applicability to their practice setting.
To perform a primary research study, an investigator identifies a problem or question in a particular population that is amenable to the study, designs a research project to address that question, decides on a quantitative or qualitative methodology, determines an adequate sample size and recruits representative subjects, and systematically collects and analyzes data to address specific research questions. On the other hand, an SDA addresses new questions from that dataset previously gathered for a different primary study ( Castle, 2003 ). This might sound “easier,” but investigators who carry out SDA research must have a broad knowledge base and be up to date regarding the state of the science in their area of interest to identify important research questions, find appropriate datasets, and apply the same research principles as primary researchers.
Most SDAs use quantitative data, but some qualitative studies lend themselves to SDA. The researcher must have access to source data, as opposed to secondary source data (e.g., a medical record review). Original qualitative data sources could be videotaped or audiotaped interviews or transcripts, or other notes from a qualitative study ( Rew, Koniak-Griffin, Lewis, Miles, & O’Sullivan, 2000 ). Another possible source for qualitative analysis is open-ended survey questions that reflect greater meaning than forced-response items.
SECONDARY ANALYSIS PROCESS
An SDA researcher starts with a research question or hypothesis, then identifies an appropriate dataset or sets to address it; alternatively, they are familiar with a dataset and peruse it to identify other questions that might be answered by the available data ( Cheng & Phillips, 2014 ). In reality, SDA researchers probably move back and forth between these approaches. For example, an investigator who starts with a research question but does not find a dataset with all needed variables usually must modify the research question(s) based on the best available data.
Secondary data analysis researchers access primary data via formal (public or institutional archived primary research datasets) or informal data sharing sources (pooled datasets separately collected by two or more researchers, or other independent researchers in carrying out secondary analysis; Heaton, 2008 ). There are numerous sources of datasets for secondary analysis. For example, a graduate student might opt to perform a secondary analysis of an advisor’s research. University and government online sites may also be useful, such as the NYU Libraries Data Sources ( https://guides.nyu.edu/c.php?g=276966&p=1848686 ) or the National Cancer Institute, which has many subcategories of datasets ( https://www.cancer.gov/research/resources/search?from=0&toolTypes=datasets_databases ). The Google search engine is useful, and researchers can enter the search term “Archive sources of datasets (add key words related to oncology).”
In one secondary analysis method, researchers reuse their own data—either a single dataset or combined respective datasets to investigate new or additional questions for a new SDA.
Example of a Secondary Data Analysis
An example highlighting this method of reusing one’s own data is Winters-Stone and colleagues’ SDA of data from four previous primary studies they performed at one institution, published in the Journal of Clinical Oncology (JCO) in 2017. Their pooled sample was 512 breast cancer survivors (age 63 ± 6 years) who had been diagnosed and treated for nonmetastatic breast cancer 5.8 years (± 4.1 years) earlier. The investigators divided the cohort, which had no diagnosed neurologic conditions, into two groups: women who reported symptoms consistent with lower-extremity chemotherapy-induced peripheral neuropathy (CIPN; numbness, tingling, or discomfort in feet) vs. CIPN-negative women who did not have symptoms. The objectives of the study were to define patient-reported prevalence of CIPN symptoms in women who had received chemotherapy, compare objective and subjective measures of CIPN in these cancer survivors, and examine the relationship between CIPN symptom severity and outcomes. Objective and subjective measures were used to compare groups for manifestations influenced by CIPN (physical function, disability, and falls). Actual chemotherapy regimens administered had not been documented (a study limitation, but regimens likely included a taxane that is neurotoxic); therefore, investigators could only confirm that symptoms began during chemotherapy and how severely patients rated symptoms.
Up to 10 years after completing chemotherapy, 47% of women who had received chemotherapy were still having significant and potentially life-threatening sensory symptoms consistent with CIPN, did worse on physical function tests, reported poorer functioning, had greater disability, and had nearly twice the rate of falls compared with CIPN-negative women ( Winters-Stone et al., 2017 ). Furthermore, symptom severity was related to worse outcomes, while worsening cancer was not.
Stout (2017) recognized the importance of this secondary analysis in an accompanying editorial published in JCO, remarking that it was the first study that included both patient-reported subjective measures and objective measures of a clinically significant problem. Winter-Stone and others (2017) recognized that by analyzing what essentially became a large sample, they were able to achieve a more comprehensive understanding of the significance and impact of CIPN, and thus to challenge the notion that while CIPN may improve over time, it remains a major cancer survivorship issue. Thus, oncology advanced practitioners must systematically address CIPN at baseline and over time in vulnerable patients, and collaborate with others to implement potentially helpful interventions such as physical and occupational therapy ( Silver & Gilchrist, 2011 ). Other primary or secondary research projects might focus on the usefulness of such interventions.
ADVANTAGES OF SECONDARY DATA ANALYSIS
The advantages of doing SDA research that are cited most often are the economic savings—in time, money, and labor—and the convenience of using existing data rather than collecting primary data, which is usually the most time-consuming and expensive aspect of research ( Johnston, 2014 ; Rew et al., 2000 ; Tripathy, 2013 ). If there is a cost to access datasets, it is usually small (compared to performing the data collection oneself), and detailed information about data collection and statistician support may also be available ( Cheng & Phillips, 2014 ). Secondary data analysis may help a new investigator increase his/her clinical research expertise and avoid data collection challenges (e.g., recruiting study participants, obtaining large-enough sample sizes to yield convincing results, avoiding study dropout, and completing data collection within a reasonable time). Secondary data analyses may also allow for examining more variables than would be feasible in smaller studies, surveys of more diverse samples, and the ability to rethink data and use more advanced statistical techniques in analysis ( Rew et al., 2000 ).
Secondary Data Analysis to Answer Additional Research Questions
Another advantage is that an SDA of a large dataset, possibly combining data from more than one study or by using longitudinal data, can address high-impact, clinically important research questions that might be prohibitively expensive or time-consuming for primary study, and potentially generate new hypotheses ( Smith et al., 2011 ; Tripathy, 2013 ). Schadendorf and others (2015) did one such SDA: a pooled analysis of 12 phase II and phase III studies of ipilimumab (Yervoy) for patients with metastatic melanoma. The study goal was to more accurately estimate the long-term survival benefit of ipilimumab every 3 weeks for greater than or equal to 4 doses in 1,861 patients with advanced melanoma, two thirds of whom had been previously treated and one third who were treatment naive. Almost 89% of patients had received ipilimumab at 3 mg/kg (n = 965), 10 mg/kg (n = 706), or other doses, and about 54% had been followed for longer than 5 years. Across all studies, overall survival curves plateaued between 2 and 3 years, suggesting a durable survival benefit for some patients.
Irrespective of prior therapy, ipilimumab dose, or treatment regimen, median overall survival was 13.5 months in treatment naive patients and 10.7 months in previously treated patients ( Schadendorf et al., 2015 ). In addition, survival curves consistently plateaued at approximately year 3 and continued for up to 10 years (longest follow-up). This suggested that most of the 20% to 26% of patients who reached the plateau had a low risk of death from melanoma thereafter. The authors viewed these results as “encouraging,” given the historic median overall survival in patients with advanced melanoma of 8 to 10 months and 5-year survival of approximately 10%. They identified limitations of their SDA (discussed later in this article). Three-year survival was numerically (but not statistically significantly) greater for the patients who received ipilimumab at 10 mg/kg than at 3 mg/kg doses, which had been noted in one of the included studies.
The importance of this secondary analysis was clearly relevant to prescribers of anticancer therapies, and led to a subsequent phase III trial in the same population to answer the ipilimumab dose question. Ascierto and colleagues’ (2017) study confirmed ipilimumab at 10 mg/kg led to a significantly longer overall survival than at 3 mg/kg (15.7 months vs. 11.5 months) in a subgroup of patients not previously treated with a BRAF inhibitor or immune checkpoint inhibitor. However, this was attained at the cost of greater treatment-related adverse events and more frequent discontinuation secondary to severe ipilimumab-related adverse events. Both would be critical points for advanced practitioners to discuss with patients and to consider in relationship to the particular patient’s ability to tolerate a given regimen.
Secondary Data Analysis to Avoid Study Repetition and Over-Research
Secondary data analysis research also avoids study repetition and over-research of sensitive topics or populations ( Tripathy, 2013 ). For example, people treated for cancer in the United Kingdom are surveyed annually through the National Cancer Patient Experience Survey (NCPES), and questions regarding sexual orientation were first included in the 2013 NCPES. Hulbert-Williams and colleagues (2017) did a more rigorous SDA of this survey to gain an understanding of how lesbian, gay, or bisexual (LGB) patients’ experiences with cancer differed from heterosexual patients.
Sixty-four percent of those surveyed responded (n = 68,737) to the question regarding their “best description of sexual orientation.” 89.3% indicated “heterosexual/straight,” 425 (0.6%) indicated “lesbian or gay,” and 143 (0.2%) indicated “bisexual.” One insight gained from the study was that although the true population proportion of LGB was not known, the small number of self-identified LGB patients most likely did not reflect actual numbers and may have occurred because of ongoing unwillingness to disclose sexual orientation, along with the older mean age of the sample. Other cancer patients who selected “prefer not to answer” (3%), “other” (0.9%), or left the question blank (6%), were not included in the SDA to correctly avoid bias in assuming these responses were related to sexual orientation.
Bisexual respondents were significantly more likely to report that nurses or other health-care professionals informed them about their diagnosis, but that it was subsequently difficult to contact nurse specialists and get understandable answers from them; they were dissatisfied with their interaction with hospital nurses and the care and help provided by both health and social care services after leaving the hospital. Bisexual and lesbian/gay respondents wanted to be involved in treatment decision-making, but therapy choices were not discussed with them, and they were all less satisfied than heterosexuals with the information given to them at diagnosis and during treatment and aftercare—an important clinical implication for oncology advanced practitioners.
Hulbert-Williams and colleagues (2017) proposed that while health-care communication and information resources are not explicitly homophobic, we may perpetuate heterosexuality as “normal” by conversational cues and reliance on heterosexual imagery that implies a context exclusionary of LGB individuals. Sexual orientation equality is about matching care to individual needs for all patients regardless of sexual orientation rather than treating everyone the same way, which does not seem to have happened according to the surveyed respondents’ perceptions. In addition, although LGB respondents replied they did not have or chose to exclude significant others from their cancer experience, there was no survey question that clarified their primary relationship status. This is not a unique strategy for persons with cancer, as LGB individuals may do this to protect family and friends from the negative consequences of homophobia.
Hulbert-Williams and others (2017) identified that this dataset might be useful to identify care needs for patients who identify as LGBT or LGBTQ (queer or questioning; no universally used acronym) and be used to obtain more targeted information from subsequent surveys. There is a relatively small body of data for advanced practitioners and other providers that aid in the assessment and care (including supportive, palliative, and survivorship care) of LGBT individuals—a minority group with many subpopulations that may have unique needs. One such effort is the white paper action plan that came out of the first summit on cancer in the LGBT communities. In 2014, participants from the United States, the United Kingdom, and Canada met to identify LGBT communities’ concerns and needs for cancer research, clinical cancer care, health-care policy, and advocacy for cancer survivorship and LGBT health equity ( Burkhalter et al., 2016 ).
More specifically, Healthy People 2020 now includes two objectives regarding LGBT issues: (1) to increase the number of population-based data systems used to monitor Healthy People 2020 objectives, including a standardized set of questions that identify lesbian, gay, bisexual, and transgender populations; and (2) to increase the number of states and territories that include questions that identify sexual orientation and gender identity on state-level surveys or data systems ( Office of Disease Prevention and Health Promotion, 2019 ). We should help each patient to designate significant others’ (family or friends) degree of involvement in care, while recognizing that LGB patients may exclude their significant others if this process involves disclosing sexual orientation, as this may lead to continued social isolation of cancer patients. This SDA by Hulbert-Williams and colleagues (2017) produced findings in a relatively unexplored area of the overall care experiences of LGB patients.
DISADVANTAGES OF SECONDARY DATA ANALYSIS
Many drawbacks of SDA research center around the fact that a primary investigator collected data reflecting his/her unique perspectives and questions, which may not fit an SDA researcher’s questions ( Rew et al., 2000 ). Secondary data analysis researchers have no control over a desired study population, variables of interest, and study design, and probably did not have a role in collecting the primary data ( Castle, 2003 ; Johnston, 2014 ; Smith et al., 2011 ).
Furthermore, the primary data may not include particular demographic information (e.g., respondent zip codes, race, ethnicity, and specific ages) that were deleted to protect respondent confidentiality, or some other different variables that might be important in the SDA may not have been examined at all ( Cheng & Phillips, 2014 ; Johnston, 2014 ). Although primary data collection takes longer than SDA data collection, identifying and procuring suitable SDA data, analyzing the overall quality of the data, determining any limitations inherent in the original study, and determining whether there is an appropriate fit between the purpose of the original study and the purpose of the SDA can be very time consuming ( Castle, 2003 ; Cheng & Phillips, 2014 ; Rew et al., 2000 ).
Secondary data analysis research may be limited to descriptive, exploratory, and correlational designs and nonparametric statistical tests. By their nature, SDA studies are observational and retrospective, and the investigator cannot examine causal relationships (by a randomized, controlled design). An SDA investigator is challenged to decide whether archival data can be shaped to match new research questions; this means the researcher must have an in-depth understanding of the dataset and know how to alter research questions to match available data and recoded variables.
For example, in their pooled analysis of ipilimumab for advanced melanoma, Schadendorf and colleagues (2015) recognized study limitations that might also be disadvantages of other SDAs. These included the fact that they could not make definitive conclusions about the relationship of survival to ipilimumab dose because the study was not randomized, had no control group, and could not account for key baseline prognostic factors. Other limitations were differences in patient populations in several studies included in the SDA, studies that had been done over 10 years ago (although no other new therapies had improved overall survival during that time), and the fact that treatments received after ipilimumab could have affected overall survival.
READING SECONDARY ANALYSIS RESEARCH
Primary and secondary data investigators apply the same research principles, which should be evident in research reports ( Cheng & Phillips, 2014 ; Hulbert-Williams et al., 2017 ; Johnston, 2014 ; Rew et al., 2000 ; Smith et al., 2011 ; Tripathy, 2013 ).
- ● Did the investigator(s) make a logical and convincing case for the importance of their study?
- ● Is there a clear research question and/or study goals or objectives?
- ● Are there operational definitions for the variables of interest?
- ● Did the authors acknowledge the source of the original data and acquire ethical approval (as necessary)?
- ● Did the authors discuss the strengths and weaknesses of the dataset? For example, how old are the data? Is the dataset sufficiently large to have confidence in the results (adequately powered)?
- ● How well do the data seem to “fit” the SDA research question and design?
- ● Does the methods section allow you, the reader, to “see” how the study was done (e.g., how the sample was selected, the tools/instruments that were used, as well their validity and reliability to measure what was intended, the data collection process, and how the data was analyzed)?
- ● Do the findings, discussion, and conclusions—positive or negative—allow you to answer the “So what?” question, and does your evaluation match the investigator’s conclusion?
Answering these questions allows the advanced practice provider reader to assess the possible value of a secondary analysis (similarly to a primary research) report and its applicability to practice, and to identify further issues or areas for scientific inquiry.
The author has no conflicts of interest to disclose.
- Ascierto P. A., Del Vecchio M., Robert C., Mackiewicz A., Chiarion-Sileni V., Arance A.,…Maio M. (2017). Ipilimumab 10 mg/kg versus ipilimumab 3 mg/kg in patients with unresectable or metastatic melanoma: A randomised, double-blind, multicentre, phase 3 trial . Lancet Oncology , 18 ( 5 ), 611–622. 10.1016/S1470-2045(17)30231-0 [ PubMed ] [ CrossRef ] [ Google Scholar ]
- Burkhalter J. E., Margolies L., Sigurdsson H. O., Walland J., Radix A., Rice D.,…Maingi S. (2016). The National LGBT Cancer Action Plan: A white paper of the 2014 National Summit on Cancer in the LGBT Communities . LGBT Health , 3 ( 1 ), 19–31. 10.1089/lgbt.2015.0118 [ CrossRef ] [ Google Scholar ]
- Castle J. E. (2003). Maximizing research opportunities: Secondary data analysis . Journal of Neuroscience Nursing , 35 ( 5 ), 287–290. Retrieved from https://www.ncbi.nlm.nih.gov/pubmed/14593941 [ PubMed ] [ Google Scholar ]
- Cheng H. G., & Phillips M. R. (2014). Secondary analysis of existing data: Opportunities and implementation . Shanghai Archives of Psychiatry , 26 ( 6 ), 371–375. https://dx.doi.org/10.11919%2Fj.issn.1002-0829.214171 [ PMC free article ] [ PubMed ] [ Google Scholar ]
- Heaton J. (2008). Secondary analysis of qualitative data: An overview . Historical Social Research , 33 ( 3 ), 33–45. [ Google Scholar ]
- Hulbert-Williams N. J., Plumpton C. O., Flowers P., McHugh R., Neal R. D., Semlyen J., & Storey L. (2017). The cancer care experiences of gay, lesbian and bisexual patients: A secondary analysis of data from the UK Cancer Patient Experience Survey . European Journal of Cancer Care , 26 ( 4 ). 10.1111/ecc.12670 [ PubMed ] [ CrossRef ] [ Google Scholar ]
- Johnston M. P. (2014). Secondary data analysis: A method of which the time has come . Qualitative and Quantitative Methods in Libraries (QQML) , 3 , 619–626.r [ Google Scholar ]
- Office of Disease Prevention and Health Promotion. (2019). Lesbian, gay, bisexual, and transgender health . Retrieved from https://www.healthypeople.gov/2020/topics-objectives/topic/lesbian-gay-bisexual-and-transgender-health
- Rew L., Koniak-Griffin D., Lewis M. A., Miles M., & O’Sullivan A. (2000). Secondary data analysis: New perspective for adolescent research . Nursing Outlook , 48 ( 5 ), 223–239. 10.1067/mno.2000.104901 [ PubMed ] [ CrossRef ] [ Google Scholar ]
- Schadendorf D., Hodi F. S., Robert C., Weber J. S., Margolin K., Hamid O.,…Wolchok J. D. (2015). Pooled analysis of long-term survival data from phase II and phase III trials of ipilimumab in unresectable or metastatic melanoma . Journal of Clinical Oncology , 33 ( 17 ), 1889–1894. 10.1200/JCO.2014.56.2736 [ PMC free article ] [ PubMed ] [ CrossRef ] [ Google Scholar ]
- Silver J. K., & Gilchrist L. S. (2011). Cancer rehabilitation with a focus on evidence-based outpatient physical and occupational therapy interventions . American Journal of Physical Medicine & Rehabilitation , 90 ( 5 Suppl 1 ), S5–S15. 10.1097/PHM.0b013e31820be4ae [ PubMed ] [ CrossRef ] [ Google Scholar ]
- Smith A. K., Ayanian J. Z., Covinsky K. E., Landon B. E., McCarthy E. P., Wee C. C., & Steinman M. A. (2011). Conducting high-value secondary dataset analysis: An introductory guide and resources . Journal of General Internal Medicine , 26 ( 8 ), 920–929. 10.1007/s11606-010-1621-5 [ PMC free article ] [ PubMed ] [ CrossRef ] [ Google Scholar ]
- Stout N. L. (2017). Expanding the perspective on chemotherapy-induced peripheral neuropathy management . Journal of Clinical Oncology , 35 ( 23 ), 2593–2594. 10.1200/JCO.2017.73.6207 [ PubMed ] [ CrossRef ] [ Google Scholar ]
- Tripathy J. P. (2013). Secondary data analysis: Ethical issues and challenges (letter) . Iranian Journal of Public Health , 42 ( 12 ), 1478–1479. [ PMC free article ] [ PubMed ] [ Google Scholar ]
- Winters-Stone K. M., Horak F., Jacobs P. G., Trubowitz P., Dieckmann N. F., Stoyles S., & Faithfull S. (2017). Falls, functioning, and disability among women with persistent symptoms of chemotherapy-induced peripheral neuropathy . Journal of Clinical Oncology , 35 ( 23 ) , 2604–2612. 10.1200/JCO.2016 [ PMC free article ] [ PubMed ] [ CrossRef ] [ Google Scholar ]

- Teesside University Student & Library Services
- Learning Hub Group
Research Methods
Secondary research.
- Primary Research
What is Secondary Research?
Advantages and disadvantages of secondary research, secondary research in literature reviews, secondary research - going beyond literature reviews, main stages of secondary research, useful resources, using material on this page.
- Quantitative Research This link opens in a new window
- Qualitative Research This link opens in a new window
- Being Critical This link opens in a new window
- Subject LibGuides This link opens in a new window

Secondary research
Secondary research uses research and data that has already been carried out. It is sometimes referred to as desk research. It is a good starting point for any type of research as it enables you to analyse what research has already been undertaken and identify any gaps.
You may only need to carry out secondary research for your assessment or you may need to use secondary research as a starting point, before undertaking your own primary research .
Searching for both primary and secondary sources can help to ensure that you are up to date with what research has already been carried out in your area of interest and to identify the key researchers in the field.
"Secondary sources are the books, articles, papers and similar materials written or produced by others that help you to form your background understanding of the subject. You would use these to find out about experts’ findings, analyses or perspectives on the issue and decide whether to draw upon these explicitly in your research." (Cottrell, 2014, p. 123).
Examples of secondary research sources include:.
- journal articles
- official statistics, such as government reports or organisations which have collected and published data
Primary research involves gathering data which has not been collected before. Methods to collect it can include interviews, focus groups, controlled trials and case studies. Secondary research often comments on and analyses this primary research.
Gopalakrishnan and Ganeshkumar (2013, p. 10) explain the difference between primary and secondary research:
"Primary research is collecting data directly from patients or population, while secondary research is the analysis of data already collected through primary research. A review is an article that summarizes a number of primary studies and may draw conclusions on the topic of interest which can be traditional (unsystematic) or systematic".
Secondary Data
As secondary data has already been collected by someone else for their research purposes, it may not cover all of the areas of interest for your research topic. This research will need to be analysed alongside other research sources and data in the same subject area in order to confirm, dispute or discuss the findings in a wider context.
"Secondary source data, as the name infers, provides second-hand information. The data come ‘pre-packaged’, their form and content reflecting the fact that they have been produced by someone other than the researcher and will not have been produced specifically for the purpose of the research project. The data, none the less, will have some relevance for the research in terms of the information they contain, and the task for the researcher is to extract that information and re-use it in the context of his/her own research project." (Denscombe, 2021, p. 268)
In the video below Dr. Benedict Wheeler (Senior Research Fellow at the European Center for Environment and Human Health at the University of Exeter Medical School) discusses secondary data analysis. Secondary data was used for his research on how the environment affects health and well-being and utilising this secondary data gave access to a larger data set.
As with all research, an important part of the process is to critically evaluate any sources you use. There are tools to help with this in the Being Critical section of the guide.
Louise Corti, from the UK Data Archive, discusses using secondary data in the video below. T he importance of evaluating secondary research is discussed - this is to ensure the data is appropriate for your research and to investigate how the data was collected.
There are advantages and disadvantages to secondary research:
Advantages:
- Usually low cost
- Easily accessible
- Provides background information to clarify / refine research areas
- Increases breadth of knowledge
- Shows different examples of research methods
- Can highlight gaps in the research and potentially outline areas of difficulty
- Can incorporate a wide range of data
- Allows you to identify opposing views and supporting arguments for your research topic
- Highlights the key researchers and work which is being undertaken within the subject area
- Helps to put your research topic into perspective
Disadvantages
- Can be out of date
- Might be unreliable if it is not clear where or how the research has been collected - remember to think critically
- May not be applicable to your specific research question as the aims will have had a different focus
Literature reviews
Secondary research for your major project may take the form of a literature review . this is where you will outline the main research which has already been written on your topic. this might include theories and concepts connected with your topic and it should also look to see if there are any gaps in the research., as the criteria and guidance will differ for each school, it is important that you check the guidance which you have been given for your assessment. this may be in blackboard and you can also check with your supervisor..
The videos below include some insights from academics regarding the importance of literature reviews.
| Malcolm Williams, Professor and Director of the Cardiff School of Social Sciences, discusses how to build upon previous research by conducting a thorough literature review. | Professor Geoff Payne discusses research design and how the literature review can help determine what research methods to use as well as help to further plan your project. |
Secondary research which goes beyond literature reviews
For some dissertations/major projects there might only be a literature review (discussed above ). For others there could be a literature review followed by primary research and for others the literature review might be followed by further secondary research.
You may be asked to write a literature review which will form a background chapter to give context to your project and provide the necessary history for the research topic. However, you may then also be expected to produce the rest of your project using additional secondary research methods, which will need to produce results and findings which are distinct from the background chapter t o avoid repetition .
Remember, as the criteria and guidance will differ for each School, it is important that you check the guidance which you have been given for your assessment. This may be in Blackboard and you can also check with your supervisor.
Although this type of secondary research will go beyond a literature review, it will still rely on research which has already been undertaken. And, "just as in primary research, secondary research designs can be either quantitative, qualitative, or a mixture of both strategies of inquiry" (Manu and Akotia, 2021, p. 4).
Your secondary research may use the literature review to focus on a specific theme, which is then discussed further in the main project. Or it may use an alternative approach. Some examples are included below. Remember to speak with your supervisor if you are struggling to define these areas.
Some approaches of how to conduct secondary research include:
- A systematic review is a structured literature review that involves identifying all of the relevant primary research using a rigorous search strategy to answer a focused research question.
- This involves comprehensive searching which is used to identify themes or concepts across a number of relevant studies.
- The review will assess the q uality of the research and provide a summary and synthesis of all relevant available research on the topic.
- The systematic review guide goes into more detail about this process (The guide is aimed a PhD/Researcher students. However, students on other levels of study may find parts of the guide helpful too).
- Scoping reviews aim to identify and assess available research on a specific topic (which can include ongoing research).
- They are "particularly useful when a body of literature has not yet been comprehensively reviewed, or exhibits a complex or heterogeneous nature not amenable to a more precise systematic review of the evidence. While scoping reviews may be conducted to determine the value and probable scope of a full systematic review, they may also be undertaken as exercises in and of themselves to summarize and disseminate research findings, to identify research gaps, and to make recommendations for the future research." (Peters et al., 2015) .
- This is designed to summarise the current knowledge and provide priorities for future research.
- "A state-of-the-art review will often highlight new ideas or gaps in research with no official quality assessment." ( MacAdden, 2020).
- "Bibliometric analysis is a popular and rigorous method for exploring and analyzing large volumes of scientific data." (Donthu et al., 2021)
- Quantitative methods and statistics are used to analyse the bibliographic data of published literature. This can be used to measure the impact of authors, publications, or topics within a subject area.
The bibliometric analysis often uses the data from a citation source such as Scopus or Web of Science .
- This is a technique used to combine the statistic results of prior quantitative studies in order to increase precision and validity.
- "It goes beyond the parameters of a literature review, which assesses existing literature, to actually perform calculations based on the results collated, thereby coming up with new results" (Curtis and Curtis, 2011, p. 220)
(Adapted from: Grant and Booth, 2009, cited in Sarhan and Manu, 2021, p. 72)
- Grounded Theory is used to create explanatory theory from data which has been collected.
- "Grounded theory data analysis strategies can be used with different types of data, including secondary data." (Whiteside, Mills and McCalman, 2012)
- This allows you to use a specific theory or theories which can then be applied to your chosen topic/research area.
- You could focus on one case study which is analysed in depth, or you could examine more than one in order to compare and contrast the important aspects of your research question.
- "Good case studies often begin with a predicament that is poorly comprehended and is inadequately explained or traditionally rationalised by numerous conflicting accounts. Therefore, the aim is to comprehend an existent problem and to use the acquired understandings to develop new theoretical outlooks or explanations." (Papachroni and Lochrie, 2015, p. 81)
Main stages of secondary research for a dissertation/major project
In general, the main stages for conducting secondary research for your dissertation or major project will include:
| or ) before you dedicate too much time to your research, to make sure there is adequate published research available in that area. | |
| , or . You will need to justify which choice you make. | |
| databases for your subject area. Use your to identify these. | |
|
| |
|
|
Click on the image below to access the reading list which includes resources used in this guide as well as some additional useful resources.

This work is licensed under a Creative Commons Attribution-NonCommercial-ShareAlike 3.0 Unported License .
- << Previous: Primary Research
- Next: Quantitative Research >>
- Last Updated: Jul 9, 2024 12:18 PM
- URL: https://libguides.tees.ac.uk/researchmethods

How To Do Secondary Research or a Literature Review
What is secondary research, why is secondary research important.
- Guide License
- Literature Review
- What If I'm Unfamiliar With My Topic?
- Evaluating Sources
- Develop Your Search Strategy
- Document Your Search and Organize Your Results
- Systematic Literature Review Tips
- Ethics & Integrity
- More Information
Paul V. Galvin Library

email: [email protected]
Chat with us:
Make a research appointment:, search our faq:.
Secondary research, also known as a literature review , preliminary research , historical research , background research , desk research , or library research , is research that analyzes or describes prior research. Rather than generating and analyzing new data, secondary research analyzes existing research results to establish the boundaries of knowledge on a topic, to identify trends or new practices, to test mathematical models or train machine learning systems, or to verify facts and figures. Secondary research is also used to justify the need for primary research as well as to justify and support other activities. For example, secondary research may be used to support a proposal to modernize a manufacturing plant, to justify the use of newly a developed treatment for cancer, to strengthen a business proposal, or to validate points made in a speech.
Because secondary research is used for so many purposes in so many settings, all professionals will be required to perform it at some point in their careers. For managers and entrepreneurs, regardless of the industry or profession, secondary research is a regular part of worklife, although parts of the research, such as finding the supporting documents, are often delegated to juniors in the organization. For all these reasons, it is essential to learn how to conduct secondary research, even if you are unlikely to ever conduct primary research.
Secondary research is also essential if your main goal is primary research. Research funding is obtained only by using secondary research to show the need for the primary research you want to conduct. In fact, primary research depends on secondary research to prove that it is indeed new and original research and not just a rehash or replication of somebody else’s work.
- Next: Literature Review >>
- Last Updated: Jul 24, 2024 4:34 PM
- URL: https://guides.library.iit.edu/litreview
Copyright © SurveySparrow Inc. 2024 Privacy Policy Terms of Service SurveySparrow Inc.
Secondary Research: Methods, Examples, and Strategic Insights

Kate Williams
Last Updated: 29 May 2024
10 min read

Table Of Contents
Secondary Research
- An Overview
- Primary vs Secondary
Sources and References
- Conducting Research
- Pros and Cons
Secondary research involves the analysis and interpretation of existing data and information collected by others. It provides valuable insights for informed decision-making without conducting new surveys or experiments. But, why is it important for businesses? Successful enterprises attribute their strategic decisions to comprehensive secondary research. In this blog, we will look into its importance, pros and cons, and all that you need to know.
What is Secondary Research?
Secondary research is not just about compiling data. It’s about synthesizing information to draw meaningful conclusions. Analysts sift through vast datasets, identifying patterns, trends, and correlations. This methodical approach transforms raw data into actionable insights, guiding businesses in their strategic endeavors.
Simply put, it involves the analysis and interpretation of existing data and information collected by others. This data can come from a variety of sources, such as academic papers, industry reports, market studies, government publications, and online databases. By tapping into pre-existing data, businesses can gain valuable insights without the time and resource-intensive process of conducting primary research, making it a cost-effective and efficient approach.
Why not think about elevating your data collection too? SurveySparrow stands ready, a friendly suggestion to boost your research process. You can create engaging surveys, collect data, analyze, and act upon the rich insights you gain from the process.
14-day free trial • Cancel Anytime • No Credit Card Required • No Strings Attached
Primary vs Secondary Research
Now, before we delve into the details, we need to be very clear about what primary research is. Why? Because the former builds upon the latter. Secondary research can only be done upon the existence of data. And, what better way than a comparison of the two to get a better grasp?
| Direct Data Collection | Existing Data Analysis |
| Specific to Study | Broad Overview |
| Time-Consuming | Time-Efficient |
| Tailored Questions | General Insights |
| Costly | Cost-Effective |
| Fresh Information | Historical Data |
| Surveys, Interviews | Reports, Articles |
| Targeted Participants | Multiple Sources |
| Original Research | Repurposed Data |
Primary Research:
Direct Data Collection: It involves gathering data directly from the source. Researchers use methods like surveys, interviews, experiments, or observations to collect specific information tailored to their study.
Specific to Study: The data collected in primary research is exclusive to the research question at hand. It is designed to address specific inquiries and provide detailed, targeted insights into the topic of interest.
Time-Consuming: Moreover, it can be time-intensive as it requires planning, conducting surveys or interviews, and analyzing the collected data. Researchers invest significant time to ensure the accuracy and reliability of the information gathered.
Tailored Questions: Researchers formulate precise and tailored questions to extract relevant information from participants. These questions are carefully designed to elicit specific responses, contributing to the depth of the research findings.
Costly: Implementing primary research methods often involves expenses related to participant recruitment, survey administration, and data analysis. The costs can vary based on the complexity and scope of the research.
Fresh Information: It provides fresh, firsthand information directly from the participants. It offers unique perspectives and insights, making it valuable for studies requiring original data.
Read More: How To Do Primary Research: An Ultimate Guide
Existing Data Analysis: It involves the analysis and interpretation of pre-existing data. Researchers explore reports, articles, studies, and other pre-existing information to draw conclusions or generate insights.
Broad Overview: It provides a comprehensive overview of a subject matter. It encompasses a wide range of data, allowing researchers to explore multiple facets of a topic without the need for new data collection.
Time-Efficient: Researchers utilize information readily available from various sources. This approach saves time compared to the process of collecting new data through primary research methods.
General Insights: The insights gained are general. They offer a broad understanding of a topic without the specificity that primary research can provide. Basically, it forms a foundation for initial exploration.
Cost-Effective: Compared to primary research, it is cost-effective as it utilizes existing data sources. Researchers do not incur the costs associated with participant recruitment and data collection, making it a budget-friendly option.
Historical Data: Secondary research often involves historical data, which can provide trends and patterns over time. Researchers can analyze past information to identify changes, making it valuable for longitudinal studies.
When conducting secondary research for a company, the focus narrows down to specific sources that offer relevant insights into market trends, consumer behaviors, industry competition, and other business-related aspects.
Here’s a tailored list of key sources and references:

1. Industry Reports and Market Research Firms
Market research is key! Industry-specific reports from reputable market research firms offer detailed analyses, market forecasts, and competitor landscapes, aiding businesses in understanding market trends and customer demands.
2. Competitor Websites and Annual Reports
Your competitor’s website and annual reports are like their personal diary. Analyzing them provides valuable information on their products, strategies, financial performance, and market positioning, helping businesses identify competitive advantages and market gaps.
3. Trade Publications and Business Magazines
They provide industry-specific news, expert opinions, and case studies. This in turn provides insights into merging trends, best practices, and successful business strategies.
4. Government Economic Data and Regulatory Publications
Governments share economic data and regulations. For instance, you get data on GDP growth, employment rates, and industry regulations. You’ll know what’s changing and how it might affect your business.
5. Academic Journals and Research Papers
These are like textbooks. They provide in-depth information about theories and analyses. With it, you can understand the “whys” behind market behaviors.
How to Conduct Secondary Research

1. Define Your Research Questions
Clearly outline what you want to know. Define specific research questions to guide your search and keep your focus sharp. Also, remember to make the questions to the point to provide a clear direction for your study.
2. Identify Your Sources
Don’t just stick to one source. Explore all the options available to get a broad view of the subject. Later, narrow down your findings to get to the precise point you have been deducing.
3. Use Online Databases Wisely
Develop a robust set of keywords related to your topic. Utilize Boolean operators ( AND, OR, NOT ) to refine your search. Experiment with various combinations to obtain the most relevant results.
4. Evaluate Your Sources
Assess the credibility of each source. Check the author’s credentials, publication date, and publisher. Peer-reviewed journals and academic institutions are usually trustworthy.
5. Take Thorough Notes
Record key points, statistics, and quotes. Note the publication details for proper citation. Organize your notes by topic for easy reference.
6. Synthesize Information
Analyze the gathered data. Identify patterns, trends, and discrepancies. Compare and contrast information from different sources to gain comprehensive insights. By doing this, you can see how different sources complement or contradict each other.
7. Validate the Information
Once you have all the information needed, properly source and add references. Any unauthorized data can cause huge differences in the decisions you make based on the insights. In the case of academic research, create a comprehensive bibliography listing all your sources.
8. Stay Curious and Keep Exploring
Research does not end with a single project. Stay curious about new developments, theories, and research findings. Continue learning to broaden your knowledge base and refine your research skills.
Types of Secondary Research
1. literature reviews.
Literature reviews involve analyzing existing academic publications, research papers, books, and articles related to the topic of study. Through literature reviews, scholars gain insights into the evolution of ideas, theories, and methodologies, providing a solid foundation for their research endeavors.
2. Content Analysis
Content analysis is a methodical examination of various media forms, such as articles, advertisements, social media posts, or documents, to extract meaningful insights. Researchers scrutinize the content to identify patterns, themes, attitudes, or trends within the material. This method is widely used in media studies, communication, and social sciences.
3. Historical Analysis
This method allows researchers to explore the social, cultural, and political factors that have shaped societies, providing valuable context for contemporary studies. It is the meticulous study of historical documents, records, artifacts, or events to gain insights into past behaviors or trends.
4. Case Studies
Case studies delve into specific instances, organizations, or events, offering an in-depth exploration of real-life situations. Researchers analyze existing reports, documents, or publications related to the chosen case to extract valuable insights. It is widely used in business, social sciences, and medical research.
5. Surveys and Polls
Surveys and polls involve the analysis of data that is collected from diverse populations. Researchers explore data sets generated by organizations or research institutions through survey administration. They provide the quantitative data you need to make informed decisions. Moreover, they make it easy to gain insights into public opinions, attitudes, behaviors, or trends across various demographics.
Read More: How to Conduct a Survey
Pros and Cons of Secondary Research
Cost-Effectiveness: Utilizes existing data, saving on research costs. Time Efficiency: Quick access to a wide range of data. Broad Scope: Covers diverse topics and historical data. In-Depth Analysis: Enables detailed examination and exploration.
Disadvantages
Data Quality Concerns: Varied quality and potential biases in existing data. Limited Control: No control over data collection, limiting specific variables. Data Relevance: Data might not precisely align with research questions. Outdated Information: Data can become obsolete in rapidly changing fields.
Alright, before we end this, let’s talk timing! Secondary research guides you through different points of your research process. Imagine you are at the beginning, trying to go deeper into the topic. This is where it comes of use. It gives you foundational knowledge and helps you refine your questions. Then, later, when you’re digging into scholarly articles, research shows you where others have tread and where unexplored territories lie.
So, before you conduct primary research make sure you make a quick secondary research pitstop. It will not only save you time and effort but also help you understand the trends that matter, whether you’re at the beginning, middle, or even near the end of your research.
And, while you’re at it, make sure you stop by SurveySparrow and give it a try! This pitstop might be your ultimate solution.
Content Marketer at SurveySparrow
You Might Also Like
")
Customer Experience
Customer Feedback Analysis: A Mini-Guide (with Examples)

How To Write An Executive Summary In 2024?

Stepping into a new decade: What's evolving from 2010 to 2020 in SaaS
")
50+ Best Secret Santa Survey Questions You Must Ask (With Free Template)
Turn every feedback into a growth opportunity.
14-day free trial • Cancel Anytime • No Credit Card Required • Need a Demo?
- Login to Survey Tool Review Center
Secondary Research Advantages, Limitations, and Sources
Summary: secondary research should be a prerequisite to the collection of primary data, but it rarely provides all the answers you need. a thorough evaluation of the secondary data is needed to assess its relevance and accuracy..
5 minutes to read. By author Michaela Mora on January 25, 2022 Topics: Relevant Methods & Tips , Business Strategy , Market Research

Secondary research is based on data already collected for purposes other than the specific problem you have. Secondary research is usually part of exploratory market research designs.
The connection between the specific purpose that originates the research is what differentiates secondary research from primary research. Primary research is designed to address specific problems. However, analysis of available secondary data should be a prerequisite to the collection of primary data.
Advantages of Secondary Research
Secondary data can be faster and cheaper to obtain, depending on the sources you use.
Secondary research can help to:
- Answer certain research questions and test some hypotheses.
- Formulate an appropriate research design (e.g., identify key variables).
- Interpret data from primary research as it can provide some insights into general trends in an industry or product category.
- Understand the competitive landscape.
Limitations of Secondary Research
The usefulness of secondary research tends to be limited often for two main reasons:
Lack of relevance
Secondary research rarely provides all the answers you need. The objectives and methodology used to collect the secondary data may not be appropriate for the problem at hand.
Given that it was designed to find answers to a different problem than yours, you will likely find gaps in answers to your problem. Furthermore, the data collection methods used may not provide the data type needed to support the business decisions you have to make (e.g., qualitative research methods are not appropriate for go/no-go decisions).
Lack of Accuracy
Secondary data may be incomplete and lack accuracy depending on;
- The research design (exploratory, descriptive, causal, primary vs. repackaged secondary data, the analytical plan, etc.)
- Sampling design and sources (target audiences, recruitment methods)
- Data collection method (qualitative and quantitative techniques)
- Analysis point of view (focus and omissions)
- Reporting stages (preliminary, final, peer-reviewed)
- Rate of change in the studied topic (slowly vs. rapidly evolving phenomenon, e.g., adoption of specific technologies).
- Lack of agreement between data sources.
Criteria for Evaluating Secondary Research Data
Before taking the information at face value, you should conduct a thorough evaluation of the secondary data you find using the following criteria:
- Purpose : Understanding why the data was collected and what questions it was trying to answer will tell us how relevant and useful it is since it may or may not be appropriate for your objectives.
- Methodology used to collect the data : Important to understand sources of bias.
- Accuracy of data: Sources of errors may include research design, sampling, data collection, analysis, and reporting.
- When the data was collected : Secondary data may not be current or updated frequently enough for the purpose that you need.
- Content of the data : Understanding the key variables, units of measurement, categories used and analyzed relationships may reveal how useful and relevant it is for your purposes.
- Source reputation : In the era of purposeful misinformation on the Internet, it is important to check the expertise, credibility, reputation, and trustworthiness of the data source.
Secondary Research Data Sources
Compared to primary research, the collection of secondary data can be faster and cheaper to obtain, depending on the sources you use.
Secondary data can come from internal or external sources.
Internal sources of secondary data include ready-to-use data or data that requires further processing available in internal management support systems your company may be using (e.g., invoices, sales transactions, Google Analytics for your website, etc.).
Prior primary qualitative and quantitative research conducted by the company are also common sources of secondary data. They often generate more questions and help formulate new primary research needed.
However, if there are no internal data collection systems yet or prior research, you probably won’t have much usable secondary data at your disposal.
External sources of secondary data include:
- Published materials
- External databases
- Syndicated services.
Published Materials
Published materials can be classified as:
- General business sources: Guides, directories, indexes, and statistical data.
- Government sources: Census data and other government publications.
External Databases
In many industries across a variety of topics, there are private and public databases that can bed accessed online or by downloading data for free, a fixed fee, or a subscription.
These databases can include bibliographic, numeric, full-text, directory, and special-purpose databases. Some public institutions make data collected through various methods, including surveys, available for others to analyze.
Syndicated Services
These services are offered by companies that collect and sell pools of data that have a commercial value and meet shared needs by a number of clients, even if the data is not collected for specific purposes those clients may have.
Syndicated services can be classified based on specific units of measurements (e.g., consumers, households, organizations, etc.).
The data collection methods for these data may include:
- Surveys (Psychographic and Lifestyle, advertising evaluations, general topics)
- Household panels (Purchase and media use)
- Electronic scanner services (volume tracking data, scanner panels, scanner panels with Cable TV)
- Audits (retailers, wholesalers)
- Direct inquiries to institutions
- Clipping services tracking PR for institutions
- Corporate reports
You can spend hours doing research on Google in search of external sources, but this is likely to yield limited insights. Books, articles journals, reports, blogs posts, and videos you may find online are usually analyses and summaries of data from a particular perspective. They may be useful and give you an indication of the type of data used, but they are not the actual data. Whenever possible, you should look at the actual raw data used to draw your own conclusion on its value for your research objectives. You should check professionally gathered secondary research.
Here are some external secondary data sources often used in market research that you may find useful as starting points in your research. Some are free, while others require payment.
- Pew Research Center : Reports about the issues, attitudes, and trends shaping the world. It conducts public opinion polling, demographic research, media content analysis, and other empirical social science research.
- Data.Census.gov : Data dissemination platform to access demographic and economic data from the U.S. Census Bureau.
- Data.gov : The US. government’s open data source with almost 200,00 datasets ranges in topics from health, agriculture, climate, ecosystems, public safety, finance, energy, manufacturing, education, and business.
- Google Scholar : A web search engine that indexes the full text or metadata of scholarly literature across an array of publishing formats and disciplines.
- Google Public Data Explorer : Makes large, public-interest datasets easy to explore, visualize and communicate.
- Google News Archive : Allows users to search historical newspapers and retrieve scanned images of their pages.
- Mckinsey & Company : Articles based on analyses of various industries.
- Statista : Business data platform with data across 170+ industries and 150+ countries.
- Claritas : Syndicated reports on various market segments.
- Mintel : Consumer reports combining exclusive consumer research with other market data and expert analysis.
- MarketResearch.com : Data aggregator with over 350 publishers covering every sector of the economy as well as emerging industries.
- Packaged Facts : Reports based on market research on consumer goods and services industries.
- Dun & Bradstreet : Company directory with business information.
Related Articles
- What Is Market Research?
- Step by Step Guide to the Market Research Process
- How to Leverage UX and Market Research To Understand Your Customers
- Why Your Business Needs Discovery Research
- Your Market Research Plan to Succeed As a Startup
- Top Reason Why Businesses Fail & What To Do About It
- What To Value In A Market Research Vendor
- Don’t Let The Budget Dictate Your Market Research Approach
- How To Use Research To Find High-Order Brand Benefits
- How To Prioritize What To Research
- Don’t Just Trust Your Gut — Do Research
- Understanding the Pros and Cons of Mixed-Mode Research
Subscribe to our newsletter to get notified about future articles
Subscribe and don’t miss anything!
Recent Articles
- How AI Can Further Remove Researchers in Search of Productivity and Lower Costs
- Re: Design/Growth Podcast – Researching User Experiences for Business Growth
- Why You Need Positioning Concept Testing in New Product Development
- Why Conjoint Analysis Is Best for Price Research
- The Rise of UX
- Making the Case Against the Van Westendorp Price Sensitivity Meter
- How to Future-Proof Experience Management and Your Business
- When Using Focus Groups Makes Sense
- How to Make Segmentation Research Actionable
- How To Integrate Market Research and UX Research for Desired Business Outcomes
Popular Articles
- Which Rating Scales Should I Use?
- What To Consider in Survey Design
- 6 Decisions To Make When Designing Product Concept Tests
- Write Winning Product Concepts To Get Accurate Results In Concept Tests
- How to Use Qualitative and Quantitative Research in Product Development
- The Opportunity of UX Research Webinar
- Myths & Misunderstandings About UX – MR Realities Podcast
- 12 Research Techniques to Solve Choice Overload
- Concept Testing for UX Researchers
- UX Research Geeks Podcast – Using Market Research for Better Context in UX
- A Researcher’s Path – Data Stories Leaders At Work Podcast
- How To Improve Racial and Gender Inclusion in Survey Design
- Privacy Overview
- Strictly Necessary Cookies
This website uses cookies so that we can provide you with the best user experience possible. Cookie information is stored in your browser and performs functions such as recognising you when you return to our website and helping our team to understand which sections of the website you find most interesting and useful.
Strictly Necessary Cookie should be enabled at all times so that we can save your preferences for cookie settings.
If you disable this cookie, we will not be able to save your preferences. This means that every time you visit this website you will need to enable or disable cookies again.

Summer is here, and so is the sale. Get a yearly plan with up to 65% off today! 🌴🌞
- Form Builder
- Survey Maker
- AI Form Generator
- AI Survey Tool
- AI Quiz Maker
- Store Builder
- WordPress Plugin
HubSpot CRM
Google Sheets
Google Analytics
Microsoft Excel
- Popular Forms
- Job Application Form Template
- Rental Application Form Template
- Hotel Accommodation Form Template
- Online Registration Form Template
- Employment Application Form Template
- Application Forms
- Booking Forms
- Consent Forms
- Contact Forms
- Donation Forms
- Customer Satisfaction Surveys
- Employee Satisfaction Surveys
- Evaluation Surveys
- Feedback Surveys
- Market Research Surveys
- Personality Quiz Template
- Geography Quiz Template
- Math Quiz Template
- Science Quiz Template
- Vocabulary Quiz Template
Try without registration Quick Start
Read engaging stories, how-to guides, learn about forms.app features.
Inspirational ready-to-use templates for getting started fast and powerful.
Spot-on guides on how to use forms.app and make the most out of it.
See the technical measures we take and learn how we keep your data safe and secure.
- Integrations
- Help Center
- Sign In Sign Up Free
- What is secondary research: Definition, methods and examples

Defne Çobanoğlu
When there is a need to gather data on a specific subject, there is more than one method to go with. Let us say you want to do general market research or you want to know how certain individuals react to a type of advertisement. You can do your secondary market research by conducting simple secondary research following pre-determined steps.
That means, instead of doing a study and extensive research to obtain information, you go through existing published documents and databases. That will help you save precious time, money, and workforce as you analyze different sources that can hand you the information. Let us find out more about secondary research and what is different from primary research.
- Let’s start with the basics: What is secondary research?
Secondary research is a type of research where you gather the data collected by other researchers and educational institutions . Some examples of secondary research sources are books, academic journals, reports, online databases, and news articles.
When conducting secondary research, it is crucial to critically evaluate the quality and relevance of the sources used and to consider any potential biases or irrelevancies of the data. It may be faster and easier to obtain, but you also need to make sure the results are up-to-date and accurate.

- Primary vs. secondary research
Primary research and secondary research are two different types of research. The main difference is in the source you gather the information from . Basically, when you conduct primary research, you get the data from the primary sources directly. You conduct surveys, do interviews, and manage focus groups or observations to get the information you want.
On the other hand, secondary research gets information from different data sources. These sources can be published books, articles, reports, databases, or any other sources of pre-existing data.

Primary research is more reliable, but it is more costly and time-consuming. And Secondary research may not provide as much accuracy, but it is cheaper, quicker, and requires fewer sources. So, the method you want to go with depends on your external sources and budget.
Secondary research methods (& examples)
Secondary research is a great way of gathering information when working on a budget. It allows you to analyze existing data. There are multiple methods you can use for your secondary research. Once you know what you want to determine from your research, you can go through possible methods to find the most suitable one. Now, let us see different secondary research methods and some examples to understand them better!
1 - Collecting data from the internet
Using the endless world of the internet is one of the most used methods. It allows expanding in different parts of the world from the comfort of your chair. There are many sources you can find that are free of charge or quite reasonable. However, you should always check the authenticity of the information to ensure they are accurate.
When you want to see the effect of different colors, placements, and keywords on your next big advertisement, you can go to Google Scholar and ResearchGate. They are two of the great sources that provide previous research and look up case studies. After looking up appropriate research done on the subject, you can conclude a final result.
2 - Reviewing of government publication
This method involves accessing and reviewing government publications, such as reports or statistics, that are publicly available. You may need to pay a sum to access these publications, or they may be classified information with no access to them. They allow you to get data on a big area of subjects.
Let us say you want to expand to a new region as a possible market, and you want to know details about the people living in the area. You can look up census details of the country or town. The sites you can search are U.S. Census Bureau or UK Office for National Statistics .
3 - Doing library research
This involves researching literature, reports, and other sources in a public or private library. Academic papers, business directories, newsletters , annual reports, and other similar documents are gathered and stored in libraries in both soft and hard copies.
When you want to see the historical views of people on a particular topic, you can conduct a literature review on the subject. For instance, if you choose a topic on sociology, you can gather all published documents on the subject of your choosing and get a result from them.
- Key steps to conduct secondary research
Secondary research involves a systematic and thorough approach to gathering and analyzing data from existing sources. One should follow these effective steps to ensure that resources are being used most efficiently. After reviewing the sources and finding the material you are after, the results can be used in decision-making and support research objectives.
1 - Define your research question or problem
When you want to start your secondary research, the first step is clearly defining your research question or problem. That way, you can identify the key information you need to gather and the relevant sources to use.
2 - Identify relevant sources
Once you have determined your research question, you need to specify the relevant sources of data and information. This may include academic journals, books, government reports, industry publications, online databases, and news articles.
3 - Evaluate the quality of the sources
It is essential to check the quality of the sources you want to use to make sure that they are up-to-date, accurate, and relevant to your research. Look for reliable sources and consider factors such as the publication date, the author's credentials, and any potential biases.
4 - Collect and analyze the data
Once you have decided on the relevant sources to work with, you can start collecting the data. This may involve taking notes, summarizing key findings, and gathering the information to draw conclusions.
5 - Interpret the data
After collecting and analyzing the data, you need to interpret the findings and draw conclusions. Consider how the information relates to your research question, and identify any patterns, trends, or gaps in the data. You may create charts, graphs, or other visual aids to help you present the data in a clear way.
- Advantages and disadvantages of secondary research
Now, we know the methods of secondary research and what exactly differentiates it from primary research. But what are the advantages and disadvantages of it? Firstly, secondary research is easily accessible as the data is already available and often involves a large sample size, which can increase the reliability and validity of the findings. Additionally, it is cost-effective and time-saving .
When it comes to the disadvantages of secondary research, the first thing that comes to mind is the fact that the data may not always be reliable , and credibility evaluation must be performed. In addition to this, even if the data is reliable, it may not be up to date . Outdated information may do more harm than good. Lastly, the original research could be biased , which would affect the result.
In conclusion, secondary research can be a useful tool for gathering information and insights for various research projects. It is an effective method of research that has its advantages. However, researchers should carefully evaluate the quality and relevance of the data and information gathered.
There are useful online applications that can help with projects and a great one of them is forms.app! forms.app is an all-in-one type online tool that can help with research purposes and much more. Be sure to check it out today!
Defne is a content writer at forms.app. She is also a translator specializing in literary translation. Defne loves reading, writing, and translating professionally and as a hobby. Her expertise lies in survey research, research methodologies, content writing, and translation.
- Form Features
- Data Collection
Table of Contents
- Secondary research methods (& examples)
Related Posts

Your definitive guide to the value curve
Fatih Serdar Çıtak

A full guide to the Thematic Analysis
-cover.png "secondary research methodology")
12 Best ProProfs Quiz Maker alternatives in 2024 (free & paid)
- Voxco Online
- Voxco Panel Management
- Voxco Panel Portal
- Voxco Audience
- Voxco Mobile Offline
- Voxco Dialer Cloud
- Voxco Dialer On-premise
- Voxco TCPA Connect
- Voxco Analytics
- Voxco Text & Sentiment Analysis

- 40+ question types
- Drag-and-drop interface
- Skip logic and branching
- Multi-lingual survey
- Text piping
- Question library
- CSS customization
- White-label surveys
- Customizable ‘Thank You’ page
- Customizable survey theme
- Reminder send-outs
- Survey rewards
- Social media
- Website surveys
- Correlation analysis
- Cross-tabulation analysis
- Trend analysis
- Real-time dashboard
- Customizable report
- Email address validation
- Recaptcha validation
- SSL security
Take a peek at our powerful survey features to design surveys that scale discoveries.
Download feature sheet.
- Hospitality
- Academic Research
- Customer Experience
- Employee Experience
- Product Experience
- Market Research
- Social Research
- Data Analysis
Explore Voxco
Need to map Voxco’s features & offerings? We can help!
Watch a Demo
Download Brochures
Get a Quote
- NPS Calculator
- CES Calculator
- A/B Testing Calculator
- Margin of Error Calculator
- Sample Size Calculator
- CX Strategy & Management Hub
- Market Research Hub
- Patient Experience Hub
- Employee Experience Hub
- NPS Knowledge Hub
- Market Research Guide
- Customer Experience Guide
- Survey Research Guides
- Survey Template Library
- Webinars and Events
- Feature Sheets
- Try a sample survey
- Professional Services

Get exclusive insights into research trends and best practices from top experts! Access Voxco’s ‘State of Research Report 2024 edition’ .
We’ve been avid users of the Voxco platform now for over 20 years. It gives us the flexibility to routinely enhance our survey toolkit and provides our clients with a more robust dataset and story to tell their clients.
VP Innovation & Strategic Partnerships, The Logit Group
- Client Stories
- Voxco Reviews
- Why Voxco Research?
- Careers at Voxco
- Vulnerabilities and Ethical Hacking
Explore Regional Offices
- Survey Software The world’s leading omnichannel survey software
- Online Survey Tools Create sophisticated surveys with ease.
- Mobile Offline Conduct efficient field surveys.
- Text Analysis
- Close The Loop
- Automated Translations
- NPS Dashboard
- CATI Manage high volume phone surveys efficiently
- Cloud/On-premise Dialer TCPA compliant Cloud on-premise dialer
- IVR Survey Software Boost productivity with automated call workflows.
- Analytics Analyze survey data with visual dashboards
- Panel Manager Nurture a loyal community of respondents.
- Survey Portal Best-in-class user friendly survey portal.
- Voxco Audience Conduct targeted sample research in hours.
- Predictive Analytics
- Customer 360
- Customer Loyalty
- Fraud & Risk Management
- AI/ML Enablement Services
- Credit Underwriting

Find the best survey software for you! (Along with a checklist to compare platforms)
Get Buyer’s Guide
- 100+ question types
- SMS surveys
- Financial Services
- Banking & Financial Services
- Retail Solution
- Risk Management
- Customer Lifecycle Solutions
- Net Promoter Score
- Customer Behaviour Analytics
- Customer Segmentation
- Data Unification
Explore Voxco
Watch a Demo
Download Brochures
- CX Strategy & Management Hub
- The Voxco Guide to Customer Experience
- Professional services
- Blogs & White papers
- Case Studies
Find the best customer experience platform
Uncover customer pain points, analyze feedback and run successful CX programs with the best CX platform for your team.
Get the Guide Now

VP Innovation & Strategic Partnerships, The Logit Group
- Why Voxco Intelligence?
- Our clients
- Client stories
- Featuresheets
Secondary Research: Definition, Methods & Examples
- August 19, 2021
The ultimate secondary research guide
Upgrade your secondary research with agile market research guide.
SHARE THE ARTICLE ON

Research doesn’t only include gathering data directly from the subject matter using surveys or interviews. You can also rely on existing data to answer your research question. The use of existing data to conduct research is known as a secondary research methodology.
In this blog, we’ll explore secondary research definitions, types, advantages, processes, and when to use them.
What is Secondary Research?
Secondary quantitative research is also known as desk research. It includes using the existing data, also known as secondary data. This existing data is then summarized and arranged to increase the overall efficacy of the research. This research method involves collecting data from the internet, government documents or resources, libraries, and other conducted research, etc.
Secondary research is cost-effective as compared to primary research. This is because secondary research uses data that is already existing. In contrast, in primary research, the data is collected by the researcher in person or they collect it with the help of a third party on their behalf.
Researchers use secondary research to accentuate the data points collected via primary research methods like online surveys or CATI surveys. While primary research can be costly, there are online survey tools like Voxco which allow researchers to conduct cost-effective survey research.
Read how Voxco helped Modus Research increase research efficiency with Voxco Online, CATI, IVR, and panel system.
Secondary research methods with examples.

The reason why many organizations use secondary research methods is because of their cost-effective nature. Since not every organization can pay large sums of money just for the purpose of market research, they use secondary sources of data and collate it for analysis. Hence, this is why secondary research is called “desk research” as the data for the research can be made available while sitting behind a desk.
We have highlighted some of the popularly used secondary research methods below:
1. Information available on the Internet:
The Internet has become the most popular way of collecting data for secondary research. Here, the data is readily accessible and available and can be easily downloaded with minimum effort. This data also tend to be free of cost or available at a negligible price.
Websites also contain tons of information that can be useful for organizations and businesses. However, it is essential only to collect data from a trusted website as some websites may compromise your system’s safety. Most of the informative information is collected by market research agencies using online surveys & market research tools.
For example, a researcher can find out the number of people using a preferred brand of clothing by a poll conducted by an independent website online.
2. Gathering information from government and non-government agencies:
Another source of acquiring secondary data is through government and non-government agencies. For instance, the U.S. Census Bureau has valuable demographic data that can be useful for researchers.
Researchers may have to pay a certain amount to download or access data with these agencies. However, the data obtained is authentic, accurate, and trustworthy. Most of the information is collected using online survey tools like Voxco.
A wide range of online survey tool functionalities to create interactive surveys in seconds.
Understand how easy it is to create, test, distribute, and design the surveys.
3. Public libraries:
Public libraries are also a rich place to gather secondary data from. They have copies of publications of research done before, which can be of good use to the researcher. They also have a wealth of documents containing important information. The services provided in one library may vary from another, though. However, commonly, libraries have documents from government publications, market research papers, business directories, and newsletters.
4. Educational Institutions:
Gaining secondary data from educational institutions is overlooked by researchers. However, these institutes contain large amounts of market research conducted as compared to any other sector. The data collected from universities is usually for primary research. Business researchers can approach the colleges and request secondary data from them.
5. Reviewing the existing literature
on a particular topic from online sources, libraries, or commercial databases is the most inexpensive method of collecting data. The information in these sources can help a researcher discover a hypothesis that they can test.
Here, sources can include information from newspapers, research journals, books, government documents, annual reports published by organizations, etc. However, the authenticity of the sources needs to be considered and examined.
Government sources can provide authentic data but may require you to pay a nominal price to acquire it. Research agencies also produce data that you can acquire at a nominal cost, and this data tends to be quantitative in nature.
Another method that is increasing in popularity is gathering information from commercial information sources such as local newspapers, radio, TV, and magazines or journals. These commercial information sources feature market research data on economic developments in the country, political information, information about demographics, etc.
What are the Advantages of Secondary Research?
Let’s look into ways primary research differs from secondary research methodology.
|
|
The research is conducted by the researcher first hand. The researcher owns the data that has been collected. | Research is based on the collected data from past studies. |
It deals with raw data. | This research deals with data that has already been analysed and interpreted. |
The researcher is highly involved in primary research. | There is low level involvement of researchers in secondary research. |
The data collected in Primary research fits the needs of the researcher. | Existing data may not necessarily fit the needs of the researcher. |
Primary research is costly and time consuming. | Secondary research is relatively cheap, and not time consuming. |
Enhance research efficiency and unlock the true potential of data with Voxco.
Curious about pricing? Get personalized quotes.
Here are some advantages of using secondary research as your research methodology.
1. Easy to Collect Data :
Information that is collected for secondary research is available easily. There are also various sources from which accurate and relevant data can be pooled together. Whereas in primary research, the data is collected from scratch.
2. Cost Effective :
The secondary method is less time-consuming and cost-effective because it uses data that is easily acquired and available. Only a minimum expenditure is required to obtain most of the data.
3. Reference for other studies :
Secondary research methodology gives scope and guidance to researchers to do primary research for their organization.
4. Less Time consuming :
The secondary methodology is quicker to conduct due to the fact that data is easily available. It can be completed in a few weeks, depending on the amount of data needed or the purpose/objectives of the study.
What are the Disadvantages of Secondary Research?
Here are some limitations of the secondary research method that you must keep in mind.
1. Questionable Credibility :
The credibility of secondary data is questionable as the data is collected from outside sources. The success of the research depends upon the quality of research conducted by previos researchers.
2. Outdated datasets :
Some secondary research data may be outdated or incompatible with the recent research objective.
3. Inconsistent data:
Gathering data from multiple secondary sources may not be standardized. This can lead to challenges in data analysis, and the inconsistencies can impact the reliability of the data.
Maximize response rates by adapting to respondent preferences.
Meet respondents where they are and drive survey completion.
How to Conduct Secondary Research?
Let’s look into four steps that you can follow to conduct secondary research.
1. Define the topic:
Think about the research question you want answers to. Understand what’s the aim of conducting your research and what you are looking to achieve. Use the understanding to define the research topic.
2. Find existing sources of data:
Since this is secondary research, identify where to find data/information to answer your research question. Narrow down the sources and list people who can help you with the research.
3. Begin data collection:
Start assessing the data sources and gather the relevant information. Make sure to check the date, the source’s credibility, and the method used by the researchers.
Compare the data over time periods and different datasets to identify patterns and trends.
4. Analyze data:
Evaluate the data and see if it answers your research question. Explore and dig deeper into the topic to gather all the relevant information.
When should you use Secondary Research?
Knowing when you can use secondary research can save time and effort while also providing valuable insights. Here are some situations gathering data from secondary sources is useful.
- Before performing primary research, you can use secondary methodology to gain a general understanding of the subject matter.
- You can use it to gather market data, competitor analysis, and industry trends to understand the market landscape without needing time-consuming primary data collection.
- Before entering a market or starting a new project, you can use this methodology to conduct a feasibility study. It can help you evaluate potential risks, demands, and market trends.
Voxco helps the top 50 MR firms & 500+ global brands gather omnichannel feedback, measure sentiment, uncover insights, and act on them.
See how Voxco can enhance your research efficiency.
Secondary research methodology offers valuable information that can significantly impact your decision-making. The benefits of this methodology are numerous, from cost-effectiveness and time-saving to wider data sources.
It serves as a complementary approach to primary research. This methodology allows you to expand your understanding, validate findings, conduct a feasibility study, and develop well-informed strategies.
Explore Voxco Survey Software

+ Omnichannel Survey Software
+ Online Survey Software
+ CATI Survey Software
+ IVR Survey Software
+ Market Research Tool
+ Customer Experience Tool
+ Product Experience Software
+ Enterprise Survey Software

Customer Engagement Platform
Customer Engagement Platform SHARE THE ARTICLE ON Share on facebook Share on twitter Share on linkedin Table of Contents Did you have any idea that

Omnichannel Customer Experience
Omnichannel Customer Experience SHARE THE ARTICLE ON Table of Contents What is an Omnichannel Customer Experience? An omnichannel customer experience refers to when customers can

How Customer Feedback Surveys can keep you Ahead of your Competition
5 Innovative Market Research Techniques to Understand Consumer Behavior SHARE THE ARTICLE ON Table of Contents Introduction With the digital transformation and the new business

Interval Scale
SURVEY METHODOLOGIES Interval Scale Try a free Voxco Online sample survey! Unlock your Sample Survey SHARE THE ARTICLE ON Table of Contents What is an
Data Cleansing – Eliminate Data Errors to Grow the Business
Data Cleansing – Eliminate Data Errors To Drive Business Growth SHARE THE ARTICLE ON Table of Contents Data cleansing sounds like a funny term, but

How to improve employee experience
How to improve employee experience SHARE THE ARTICLE ON Table of Contents What is employee experience? Employee experience is defined as the totality of a
We use cookies in our website to give you the best browsing experience and to tailor advertising. By continuing to use our website, you give us consent to the use of cookies. Read More
| Name | Domain | Purpose | Expiry | Type |
|---|---|---|---|---|
| hubspotutk | www.voxco.com | HubSpot functional cookie. | 1 year | HTTP |
| lhc_dir_locale | amplifyreach.com | --- | 52 years | --- |
| lhc_dirclass | amplifyreach.com | --- | 52 years | --- |
| Name | Domain | Purpose | Expiry | Type |
|---|---|---|---|---|
| _fbp | www.voxco.com | Facebook Pixel advertising first-party cookie | 3 months | HTTP |
| __hstc | www.voxco.com | Hubspot marketing platform cookie. | 1 year | HTTP |
| __hssrc | www.voxco.com | Hubspot marketing platform cookie. | 52 years | HTTP |
| __hssc | www.voxco.com | Hubspot marketing platform cookie. | Session | HTTP |
| Name | Domain | Purpose | Expiry | Type |
|---|---|---|---|---|
| _gid | www.voxco.com | Google Universal Analytics short-time unique user tracking identifier. | 1 days | HTTP |
| MUID | bing.com | Microsoft User Identifier tracking cookie used by Bing Ads. | 1 year | HTTP |
| MR | bat.bing.com | Microsoft User Identifier tracking cookie used by Bing Ads. | 7 days | HTTP |
| IDE | doubleclick.net | Google advertising cookie used for user tracking and ad targeting purposes. | 2 years | HTTP |
| _vwo_uuid_v2 | www.voxco.com | Generic Visual Website Optimizer (VWO) user tracking cookie. | 1 year | HTTP |
| _vis_opt_s | www.voxco.com | Generic Visual Website Optimizer (VWO) user tracking cookie that detects if the user is new or returning to a particular campaign. | 3 months | HTTP |
| _vis_opt_test_cookie | www.voxco.com | A session (temporary) cookie used by Generic Visual Website Optimizer (VWO) to detect if the cookies are enabled on the browser of the user or not. | 52 years | HTTP |
| _ga | www.voxco.com | Google Universal Analytics long-time unique user tracking identifier. | 2 years | HTTP |
| _uetsid | www.voxco.com | Microsoft Bing Ads Universal Event Tracking (UET) tracking cookie. | 1 days | HTTP |
| vuid | vimeo.com | Vimeo tracking cookie | 2 years | HTTP |
| Name | Domain | Purpose | Expiry | Type |
|---|---|---|---|---|
| __cf_bm | hubspot.com | Generic CloudFlare functional cookie. | Session | HTTP |
| Name | Domain | Purpose | Expiry | Type |
|---|---|---|---|---|
| _gcl_au | www.voxco.com | --- | 3 months | --- |
| _gat_gtag_UA_3262734_1 | www.voxco.com | --- | Session | --- |
| _clck | www.voxco.com | --- | 1 year | --- |
| _ga_HNFQQ528PZ | www.voxco.com | --- | 2 years | --- |
| _clsk | www.voxco.com | --- | 1 days | --- |
| visitor_id18452 | pardot.com | --- | 10 years | --- |
| visitor_id18452-hash | pardot.com | --- | 10 years | --- |
| lpv18452 | pi.pardot.com | --- | Session | --- |
| lhc_per | www.voxco.com | --- | 6 months | --- |
| _uetvid | www.voxco.com | --- | 1 year | --- |
15 Secondary Research Examples

Dave Cornell (PhD)
Dr. Cornell has worked in education for more than 20 years. His work has involved designing teacher certification for Trinity College in London and in-service training for state governments in the United States. He has trained kindergarten teachers in 8 countries and helped businessmen and women open baby centers and kindergartens in 3 countries.
Learn about our Editorial Process

Chris Drew (PhD)
This article was peer-reviewed and edited by Chris Drew (PhD). The review process on Helpful Professor involves having a PhD level expert fact check, edit, and contribute to articles. Reviewers ensure all content reflects expert academic consensus and is backed up with reference to academic studies. Dr. Drew has published over 20 academic articles in scholarly journals. He is the former editor of the Journal of Learning Development in Higher Education and holds a PhD in Education from ACU.

Secondary research is the analysis, summary or synthesis of already existing published research. Instead of collecting original data, as in primary research , secondary research involves data or the results of data analyses already collected.
It is generally published in books, handbooks, textbooks, articles, encyclopedias, websites, magazines, literature reviews and meta-analyses. These are usually referred to as secondary sources .
Secondary research is a good place to start when wanting to acquire a broad view of a research area. It is usually easier to understand and may not require advanced training in research design and statistics.
Secondary Research Examples
1. literature review.
A literature review summarizes, reviews, and critiques the existing published literature on a topic.
Literature reviews are considered secondary research because it is a collection and analysis of the existing literature rather than generating new data for the study.
They hold value for academic studies because they enable us to take stock of the existing knowledge in a field, evaluate it, and identify flaws or gaps in the existing literature. As a result, they’re almost universally used by academics prior to conducting primary research.
Example 1: Workplace stress in nursing: a literature review
Citation: McVicar, A. (2003). Workplace stress in nursing: a literature review. Journal of advanced nursing , 44 (6), 633-642. Source: https://doi.org/10.1046/j.0309-2402.2003.02853.x
Summary: This study conducted a systematic analysis of literature on the causes of stress for nurses in the workplace. The study explored the literature published between 2000 and 2014. The authors found that the literature identifies several main causes of stress for nurses: professional relationships with doctors and staff, communication difficulties with patients and their families, the stress of emergency cases, overwork, lack of staff, and lack of support from the institutions. They conclude that understanding these stress factors can help improve the healthcare system and make it better for both nurses and patients.
Example 2: The impact of shiftwork on health: a literature review
Citation: Matheson, A., O’Brien, L., & Reid, J. A. (2014). The impact of shiftwork on health: a literature review. Journal of Clinical Nursing , 23 (23-24), 3309-3320. Source: https://doi.org/10.1111/jocn.12524
In this literature review, 118 studies were analyzed to examine the impact of shift work on nurses’ health. The findings were organized into three main themes: physical health, psychosocial health, and sleep. The majority of shift work research has primarily focused on these themes, but there is a lack of studies that explore the personal experiences of shift workers and how they navigate the effects of shift work on their daily lives. Consequently, it remains challenging to determine how individuals manage their shift work schedules. They found that, while shift work is an inevitable aspect of the nursing profession, there is limited research specifically targeting nurses and the implications for their self-care.
Example 3: Social media and entrepreneurship research: A literature review
Citation: Olanrewaju, A. S. T., Hossain, M. A., Whiteside, N., & Mercieca, P. (2020). Social media and entrepreneurship research: A literature review. International Journal of Information Management , 50 , 90-110. Source: https://doi.org/10.1016/j.ijinfomgt.2019.05.011
In this literature review, 118 studies were analyzed to examine the impact of shift work on nurses’ health. The findings were organized into three main themes: physical health, social health , and sleep. The majority of shift work research has primarily focused on these themes, but there is a lack of studies that explore the personal experiences of shift workers and how they navigate the effects of shift work on their daily lives. Consequently, it remains challenging to determine how individuals manage their shift work schedules. They found that, while shift work is an inevitable aspect of the nursing profession, there is limited research specifically targeting nurses and the implications for their self-care.
Example 4: Adoption of electric vehicle: A literature review and prospects for sustainability
Citation: Kumar, R. R., & Alok, K. (2020). Adoption of electric vehicle: A literature review and prospects for sustainability. Journal of Cleaner Production , 253 , 119911. Source: https://doi.org/10.1016/j.jclepro.2019.119911
This study is a literature review that aims to synthesize and integrate findings from existing research on electric vehicles. By reviewing 239 articles from top journals, the study identifies key factors that influence electric vehicle adoption. Themes identified included: availability of charging infrastructure and total cost of ownership. The authors propose that this analysis can provide valuable insights for future improvements in electric mobility.
Example 5: Towards an understanding of social media use in the classroom: a literature review
Citation: Van Den Beemt, A., Thurlings, M., & Willems, M. (2020). Towards an understanding of social media use in the classroom: a literature review. Technology, Pedagogy and Education , 29 (1), 35-55. Source: https://doi.org/10.1080/1475939X.2019.1695657
This study examines how social media can be used in education and the challenges teachers face in balancing its potential benefits with potential distractions. The review analyzes 271 research papers. They find that ambiguous results and poor study quality plague the literature. However, they identify several factors affecting the success of social media in the classroom, including: school culture, attitudes towards social media, and learning goals. The study’s value is that it organizes findings from a large corpus of existing research to help understand the topic more comprehensively.
2. Meta-Analyses
Meta-analyses are similar to literature reviews, but are at a larger scale and tend to involve the quantitative synthesis of data from multiple studies to identify trends and derive estimates of overall effect sizes.
For example, while a literature review might be a qualitative assessment of trends in the literature, a meta analysis would be a quantitative assessment, using statistical methods, of studies that meet specific inclusion criteria that can be directly compared and contrasted.
Often, meta-analysis aim to identify whether the existing data can provide an authoritative account for a hypothesis and whether it’s confirmed across the body of literature.
Example 6: Cholesterol and Alzheimer’s Disease Risk: A Meta-Meta-Analysis
Citation: Sáiz-Vazquez, O., Puente-Martínez, A., Ubillos-Landa, S., Pacheco-Bonrostro, J., & Santabárbara, J. (2020). Cholesterol and Alzheimer’s disease risk: a meta-meta-analysis. Brain sciences , 10 (6), 386. Source: https://doi.org/10.3390/brainsci10060386
This study examines the relationship between cholesterol and Alzheimer’s disease (AD). Researchers conducted a systematic search of meta-analyses and reviewed several databases, collecting 100 primary studies and five meta-analyses to analyze the connection between cholesterol and Alzheimer’s disease. They find that the literature compellingly demonstrates that low-density lipoprotein cholesterol (LDL-C) levels significantly influence the development of Alzheimer’s disease, but high-density lipoprotein cholesterol (HDL-C), total cholesterol (TC), and triglycerides (TG) levels do not show significant effects. This is an example of secondary research because it compiles and analyzes data from multiple existing studies and meta-analyses rather than collecting new, original data.
Example 7: The power of feedback revisited: A meta-analysis of educational feedback research
Citation: Wisniewski, B., Zierer, K., & Hattie, J. (2020). The power of feedback revisited: A meta-analysis of educational feedback research. Frontiers in Psychology , 10 , 3087. Source: https://doi.org/10.3389/fpsyg.2019.03087
This meta-analysis examines 435 empirical studies research on the effects of feedback on student learning. They use a random-effects model to ascertain whether there is a clear effect size across the literature. The authors find that feedback tends to impact cognitive and motor skill outcomes but has less of an effect on motivational and behavioral outcomes. A key (albeit somewhat obvious) finding was that the manner in which the feedback is provided is a key factor in whether the feedback is effective.
Example 8: How Much Does Education Improve Intelligence? A Meta-Analysis
Citation: Ritchie, S. J., & Tucker-Drob, E. M. (2018). How much does education improve intelligence? A meta-analysis. Psychological science , 29 (8), 1358-1369. Source: https://doi.org/10.1177/0956797618774253
This study investigates the relationship between years of education and intelligence test scores. The researchers analyzed three types of quasiexperimental studies involving over 600,000 participants to understand if longer education increases intelligence or if more intelligent students simply complete more education. They found that an additional year of education consistently increased cognitive abilities by 1 to 5 IQ points across all broad categories of cognitive ability. The effects persisted throughout the participants’ lives, suggesting that education is an effective way to raise intelligence. This study is an example of secondary research because it compiles and analyzes data from multiple existing studies rather than gathering new, original data.
Example 9: A meta-analysis of factors related to recycling
Citation: Geiger, J. L., Steg, L., Van Der Werff, E., & Ünal, A. B. (2019). A meta-analysis of factors related to recycling. Journal of environmental psychology , 64 , 78-97. Source: https://doi.org/10.1016/j.jenvp.2019.05.004
This study aims to identify key factors influencing recycling behavior across different studies. The researchers conducted a random-effects meta-analysis on 91 studies focusing on individual and household recycling. They found that both individual factors (such as recycling self-identity and personal norms) and contextual factors (like having a bin at home and owning a house) impacted recycling behavior. The analysis also revealed that individual and contextual factors better predicted the intention to recycle rather than the actual recycling behavior. The study offers theoretical and practical implications and suggests that future research should examine the effects of contextual factors and the interplay between individual and contextual factors.
Example 10: Stress management interventions for police officers and recruits
Citation: Patterson, G. T., Chung, I. W., & Swan, P. W. (2014). Stress management interventions for police officers and recruits: A meta-analysis. Journal of experimental criminology , 10 , 487-513. Source: https://doi.org/10.1007/s11292-014-9214-7
The meta-analysis systematically reviews randomized controlled trials and quasi-experimental studies that explore the effects of stress management interventions on outcomes among police officers. It looked at 12 primary studies published between 1984 and 2008. Across the studies, there were a total of 906 participants. Interestingly, it found that the interventions were not effective. Here, we can see how secondary research is valuable sometimes for showing there is no clear trend or consensus in existing literature. The conclusions suggest a need for further research to develop and implement more effective interventions addressing specific stressors and using randomized controlled trials.
3. Textbooks
Academic textbooks tend not to present new research. Rather, they present key academic information in ways that are accessible to university students and academics.
As a result, we can consider textbooks to be secondary rather than primary research. They’re collections of information and research produced by other people, then re-packaged for a specific audience.
Textbooks tend to be written by experts in a topic. However, unlike literature reviews and meta-analyses, they are not necessarily systematic in nature and are not designed to progress current knowledge through identifying gaps, weaknesses, and strengths in the existing literature.
Example 11: Psychology for the Third Millennium: Integrating Cultural and Neuroscience Perspectives
This textbook aims to bridge the gap between two distinct domains in psychology: Qualitative and Cultural Psychology , which focuses on managing meaning and norms, and Neuropsychology and Neuroscience, which studies brain processes. The authors believe that by combining these areas, a more comprehensive general psychology can be achieved, which unites the biological and cultural aspects of human life. This textbook is considered a secondary source because it synthesizes and integrates information from various primary research studies, theories, and perspectives in the field of psychology.
Example 12: Cultural Sociology: An Introduction
Citation: Bennett, A., Back, L., Edles, L. D., Gibson, M., Inglis, D., Jacobs, R., & Woodward, I. (2012). Cultural sociology: an introduction . New York: John Wiley & Sons.
This student textbook introduces cultural sociology and proposes that it is a valid model for sociological thinking and research. It gathers together existing knowledge within the field to prevent an overview of major sociological themes and empirical approaches utilized within cultural sociological research. It does not present new research, but rather packages existing knowledge in sociology and makes it understandable for undergraduate students.
Example 13: A Textbook of Community Nursing
Citation: Chilton, S., & Bain, H. (Eds.). (2017). A textbook of community nursing . New York: Routledge.
This textbook presents an evidence-based introduction to professional topics in nursing. In other words, it gathers evidence from other research and presents it to students. It covers areas such as care approaches, public health, eHealth, therapeutic relationships, and mental health. Like many textbooks, it brings together its own secondary research with user-friendly elements like exercises, activities, and hypothetical case studies in each chapter.
4. White Papers
White papers are typically produced within businesses and government departments rather than academic research environments.
Generally, a white paper will focus on a specific topic of concern to the institution in order to present a state of the current situation as well as opportunities that could be pursued for change, improvement, or profit generation in the future.
Unlike a literature review, a white paper generally doesn’t follow standards of academic rigor and may be presented with a bias toward, or focus on, a company or institution’s mission and values.
Example 14: Future of Mobility White Paper
Citation: Shaheen, S., Totte, H., & Stocker, A. (2018). Future of Mobility White Paper. UC Berkeley: Institute of Transportation Studies at UC Berkeley Source: https://doi.org/10.7922/G2WH2N5D
This white paper explores the how transportation is changing due to concerns over climate change, equity of access to transit, and rapid technological advances (such as shared mobility and automation). The authors aggregate current information and research on key trends, emerging technologies/services, impacts on California’s transportation ecosystem, and future growth projections by reviewing state agency publications, peer-reviewed articles, and forecast reports from various sources. This white paper is an example of secondary research because it synthesizes and integrates information from multiple primary research sources, expert interviews, and input from an advisory committee of local and state transportation agencies.
Example 15: White Paper Concerning Philosophy of Education and Environment
Citation: Humphreys, C., Blenkinsop, S. White Paper Concerning Philosophy of Education and Environment. Stud Philos Educ 36 (1): 243–264. Source: https://doi.org/10.1007/s11217-017-9567-2
This white paper acknowledges the increasing significance of climate change, environmental degradation, and our relationship with nature, and the need for philosophers of education and global citizens to respond. The paper examines five key journals in the philosophy of education to identify the scope and content of current environmental discussions. By organizing and summarizing the located articles, it assesses the possibilities and limitations of these discussions within the philosophy of education community. This white paper is an example of secondary research because it synthesizes and integrates information from multiple primary research sources, specifically articles from the key journals in the field, to analyze the current state of environmental discussions.
5. Academic Essays
Students’ academic essays tend to present secondary rather than primary research. The student is expected to study current literature on a topic and use it to present a thesis statement.
Academic essays tend to require rigorous standards of analysis, critique, and evaluation, but do not require systematic investigation of a topic like you would expect in a literature review.
In an essay, a student may identify the most relevant or important data from a field of research in order to demonstrate their knowledge of a field of study. They may also, after demonstrating sufficient knowledge and understanding, present a thesis statement about the issue.
Secondary research involves data that has already been collected. The published research might be reviewed, included in a meta-analysis, or subjected to a re-analysis.
These findings might be published in a peer-reviewed journal or handbook, become the foundation of a book for public consumption, or presented in a more narrative form for a popular website or magazine.
Sources for secondary research can range from scientific journals to government databases and archived data accumulated by research institutes.
University students might engage in secondary research to become familiar with an area of research. That might help spark an intriguing hypothesis for a research project of master’s thesis.
Secondary research can yield new insights into human behavior , or confirm existing conceptualizations of psychological constructs.

- Dave Cornell (PhD) https://helpfulprofessor.com/author/dave-cornell-phd/ 23 Achieved Status Examples
- Dave Cornell (PhD) https://helpfulprofessor.com/author/dave-cornell-phd/ 25 Defense Mechanisms Examples
- Dave Cornell (PhD) https://helpfulprofessor.com/author/dave-cornell-phd/ 15 Theory of Planned Behavior Examples
- Dave Cornell (PhD) https://helpfulprofessor.com/author/dave-cornell-phd/ 18 Adaptive Behavior Examples

- Chris Drew (PhD) https://helpfulprofessor.com/author/chris-drew-phd-2/ 23 Achieved Status Examples
- Chris Drew (PhD) https://helpfulprofessor.com/author/chris-drew-phd-2/ 15 Ableism Examples
- Chris Drew (PhD) https://helpfulprofessor.com/author/chris-drew-phd-2/ 25 Defense Mechanisms Examples
- Chris Drew (PhD) https://helpfulprofessor.com/author/chris-drew-phd-2/ 15 Theory of Planned Behavior Examples
Leave a Comment Cancel Reply
Your email address will not be published. Required fields are marked *
Root out friction in every digital experience, super-charge conversion rates, and optimize digital self-service
Uncover insights from any interaction, deliver AI-powered agent coaching, and reduce cost to serve
Increase revenue and loyalty with real-time insights and recommendations delivered to teams on the ground
Know how your people feel and empower managers to improve employee engagement, productivity, and retention
Take action in the moments that matter most along the employee journey and drive bottom line growth
Whatever they’re are saying, wherever they’re saying it, know exactly what’s going on with your people
Get faster, richer insights with qual and quant tools that make powerful market research available to everyone
Run concept tests, pricing studies, prototyping + more with fast, powerful studies designed by UX research experts
Track your brand performance 24/7 and act quickly to respond to opportunities and challenges in your market
Explore the platform powering Experience Management
- Free Account
- Product Demos
- For Digital
- For Customer Care
- For Human Resources
- For Researchers
- Financial Services
- All Industries
Popular Use Cases
- Customer Experience
- Employee Experience
- Net Promoter Score
- Voice of Customer
- Customer Success Hub
- Product Documentation
- Training & Certification
- XM Institute
- Popular Resources
- Customer Stories
- Artificial Intelligence
Market Research
- Partnerships
- Marketplace
The annual gathering of the experience leaders at the world’s iconic brands building breakthrough business results, live in Salt Lake City.
- English/AU & NZ
- Español/Europa
- Español/América Latina
- Português Brasileiro
- REQUEST DEMO
- Experience Management
- Primary vs Secondary Research
Try Qualtrics for free
Primary vs secondary research – what’s the difference.
14 min read Find out how primary and secondary research are different from each other, and how you can use them both in your own research program.
Primary vs secondary research: in a nutshell
The essential difference between primary and secondary research lies in who collects the data.
- Primary research definition
When you conduct primary research, you’re collecting data by doing your own surveys or observations.
- Secondary research definition:
In secondary research, you’re looking at existing data from other researchers, such as academic journals, government agencies or national statistics.
Free Ebook: The Qualtrics Handbook of Question Design
When to use primary vs secondary research
Primary research and secondary research both offer value in helping you gather information.
Each research method can be used alone to good effect. But when you combine the two research methods, you have the ingredients for a highly effective market research strategy. Most research combines some element of both primary methods and secondary source consultation.
So assuming you’re planning to do both primary and secondary research – which comes first? Counterintuitive as it sounds, it’s more usual to start your research process with secondary research, then move on to primary research.
Secondary research can prepare you for collecting your own data in a primary research project. It can give you a broad overview of your research area, identify influences and trends, and may give you ideas and avenues to explore that you hadn’t previously considered.
Given that secondary research can be done quickly and inexpensively, it makes sense to start your primary research process with some kind of secondary research. Even if you’re expecting to find out what you need to know from a survey of your target market, taking a small amount of time to gather information from secondary sources is worth doing.

Primary research
Primary market research is original research carried out when a company needs timely, specific data about something that affects its success or potential longevity.
Primary research data collection might be carried out in-house by a business analyst or market research team within the company, or it may be outsourced to a specialist provider, such as an agency or consultancy. While outsourcing primary research involves a greater upfront expense, it’s less time consuming and can bring added benefits such as researcher expertise and a ‘fresh eyes’ perspective that avoids the risk of bias and partiality affecting the research data.
Primary research gives you recent data from known primary sources about the particular topic you care about, but it does take a little time to collect that data from scratch, rather than finding secondary data via an internet search or library visit.
Primary research involves two forms of data collection:
- Exploratory research This type of primary research is carried out to determine the nature of a problem that hasn’t yet been clearly defined. For example, a supermarket wants to improve its poor customer service and needs to understand the key drivers behind the customer experience issues. It might do this by interviewing employees and customers, or by running a survey program or focus groups.
- Conclusive research This form of primary research is carried out to solve a problem that the exploratory research – or other forms of primary data – has identified. For example, say the supermarket’s exploratory research found that employees weren’t happy. Conclusive research went deeper, revealing that the manager was rude, unreasonable, and difficult, making the employees unhappy and resulting in a poor employee experience which in turn led to less than excellent customer service. Thanks to the company’s choice to conduct primary research, a new manager was brought in, employees were happier and customer service improved.
Examples of primary research
All of the following are forms of primary research data.
- Customer satisfaction survey results
- Employee experience pulse survey results
- NPS rating scores from your customers
- A field researcher’s notes
- Data from weather stations in a local area
- Recordings made during focus groups
Primary research methods
There are a number of primary research methods to choose from, and they are already familiar to most people. The ones you choose will depend on your budget, your time constraints, your research goals and whether you’re looking for quantitative or qualitative data.
A survey can be carried out online, offline, face to face or via other media such as phone or SMS. It’s relatively cheap to do, since participants can self-administer the questionnaire in most cases. You can automate much of the process if you invest in good quality survey software.
Primary research interviews can be carried out face to face, over the phone or via video calling. They’re more time-consuming than surveys, and they require the time and expense of a skilled interviewer and a dedicated room, phone line or video calling setup. However, a personal interview can provide a very rich primary source of data based not only on the participant’s answers but also on the observations of the interviewer.
Focus groups
A focus group is an interview with multiple participants at the same time. It often takes the form of a discussion moderated by the researcher. As well as taking less time and resources than a series of one-to-one interviews, a focus group can benefit from the interactions between participants which bring out more ideas and opinions. However this can also lead to conversations going off on a tangent, which the moderator must be able to skilfully avoid by guiding the group back to the relevant topic.
Secondary research
Secondary research is research that has already been done by someone else prior to your own research study.
Secondary research is generally the best place to start any research project as it will reveal whether someone has already researched the same topic you’re interested in, or a similar topic that helps lay some of the groundwork for your research project.

Even if your preliminary secondary research doesn’t turn up a study similar to your own research goals, it will still give you a stronger knowledge base that you can use to strengthen and refine your research hypothesis. You may even find some gaps in the market you didn’t know about before.
The scope of secondary research resources is extremely broad. Here are just a few of the places you might look for relevant information.
Books and magazines
A public library can turn up a wealth of data in the form of books and magazines – and it doesn’t cost a penny to consult them.
Market research reports
Secondary research from professional research agencies can be highly valuable, as you can be confident the data collection methods and data analysis will be sound
Scholarly journals, often available in reference libraries
Peer-reviewed journals have been examined by experts from the relevant educational institutions, meaning there has been an extra layer of oversight and careful consideration of the data points before publication.
Government reports and studies
Public domain data, such as census data, can provide relevant information for your research project, not least in choosing the appropriate research population for a primary research method. If the information you need isn’t readily available, try contacting the relevant government agencies.
White papers
Businesses often produce white papers as a means of showcasing their expertise and value in their field. White papers can be helpful in secondary research methods, although they may not be as carefully vetted as academic papers or public records.
Trade or industry associations
Associations may have secondary data that goes back a long way and offers a general overview of a particular industry. This data collected over time can be very helpful in laying the foundations of your particular research project.
Private company data
Some businesses may offer their company data to those conducting research in return for fees or with explicit permissions. However, if a business has data that’s closely relevant to yours, it’s likely they are a competitor and may flat out refuse your request.
Learn more about secondary research
Examples of secondary research data
These are all forms of secondary research data in action:
- A newspaper report quoting statistics sourced by a journalist
- Facts from primary research articles quoted during a debate club meeting
- A blog post discussing new national figures on the economy
- A company consulting previous research published by a competitor
Secondary research methods
Literature reviews.
A core part of the secondary research process, involving data collection and constructing an argument around multiple sources. A literature review involves gathering information from a wide range of secondary sources on one topic and summarizing them in a report or in the introduction to primary research data.
Content analysis
This systematic approach is widely used in social science disciplines. It uses codes for themes, tropes or key phrases which are tallied up according to how often they occur in the secondary data. The results help researchers to draw conclusions from qualitative data.
Data analysis using digital tools
You can analyze large volumes of data using software that can recognize and categorize natural language. More advanced tools will even be able to identify relationships and semantic connections within the secondary research materials.

Comparing primary vs secondary research
We’ve established that both primary research and secondary research have benefits for your business, and that there are major differences in terms of the research process, the cost, the research skills involved and the types of data gathered. But is one of them better than the other?
The answer largely depends on your situation. Whether primary or secondary research wins out in your specific case depends on the particular topic you’re interested in and the resources you have available. The positive aspects of one method might be enough to sway you, or the drawbacks – such as a lack of credible evidence already published, as might be the case in very fast-moving industries – might make one method totally unsuitable.
Here’s an at-a-glance look at the features and characteristics of primary vs secondary research, illustrating some of the key differences between them.
| Primary research | Secondary research |
|---|---|
| Self-conducted original research | Research already conducted by other researchers independent of your project |
| Qualitative and quantitative research | Qualitative and quantitative research |
| Relatively expensive to acquire | Relatively cheap to acquire |
| Focused on your business’ needs | Not focused on your business’ needs (usually, unless you have relevant in-house data from past research) |
| Takes some time to collect and analyze | Quick to access |
| Tailored to your project | Not tailored to your project |
What are the pros and cons of primary research?
Primary research provides original data and allows you to pinpoint the issues you’re interested in and collect data from your target market – with all the effort that entails.
Benefits of primary research:
- Tells you what you need to know, nothing irrelevant
- Yours exclusively – once acquired, you may be able to sell primary data or use it for marketing
- Teaches you more about your business
- Can help foster new working relationships and connections between silos
- Primary research methods can provide upskilling opportunities – employees gain new research skills
Limitations of primary research:
- Lacks context from other research on related subjects
- Can be expensive
- Results aren’t ready to use until the project is complete
- Any mistakes you make in in research design or implementation could compromise your data quality
- May not have lasting relevance – although it could fulfill a benchmarking function if things change
What are the pros and cons of secondary research?
Secondary research relies on secondary sources, which can be both an advantage and a drawback. After all, other people are doing the work, but they’re also setting the research parameters.
Benefits of secondary research:
- It’s often low cost or even free to access in the public domain
- Supplies a knowledge base for researchers to learn from
- Data is complete, has been analyzed and checked, saving you time and costs
- It’s ready to use as soon as you acquire it
Limitations of secondary research
- May not provide enough specific information
- Conducting a literature review in a well-researched subject area can become overwhelming
- No added value from publishing or re-selling your research data
- Results are inconclusive – you’ll only ever be interpreting data from another organization’s experience, not your own
- Details of the research methodology are unknown
- May be out of date – always check carefully the original research was conducted
Related resources
Business research methods 12 min read, qualitative research interviews 11 min read, market intelligence 10 min read, marketing insights 11 min read, ethnographic research 11 min read, qualitative vs quantitative research 13 min read, qualitative research questions 11 min read, request demo.
Ready to learn more about Qualtrics?
- Lesson Plans
- Teacher's Guides
- Media Resources
Primary and Secondary Sources: Foundations of Historical Research

Advertisement for fugitive slave from July 1837 issue of unidentified anti-slavery publication
Schomburg Center for Research in Black Culture, New York Public Library Digital Collections
Contemporary accounts created by people who were present or intimately involved in historical events – known as primary sources – are the bedrock of historical research and writing. In order to complete the research process, historians also rely on secondary sources: well-researched scholarship written after the historical event in question.
In this lesson plan, students will learn how to distinguish between primary and secondary sources and how to use them for historical research. The central type of primary sources used in this lesson plan are fugitive slave advertisements: short, concise, detailed, and engaging primary sources that convey the history of slavery and freedom seeking in striking terms. Once completed, students will have cultivated valuable research skills with which further historical questions can be investigated and answered.
This resource is a product of Claiming Freedom in the Revolutionary Era – a partnership of the National Underground Railroad Network to Freedom, the National Park Service, the National Endowment for the Humanities, the National Park Foundation, and the Greening Youth Foundation.
Guiding questions.
Why do historians use both primary and secondary sources to understand the past?
How are we creators of primary sources for historians 100 years from now?
Learning Objectives
Differentiate between a primary and secondary source.
Analyze a primary source by using a graphic organizer.
Lesson Plan Details
A familiarity with the historical research method sparks curiosity in students and teaches them to be critical clickers as they combat misinformation on the Internet.
The Historical Method in Three Phases
Historians are scrupulous researchers and detailed investigators. Traditionally, historians employ what is called the historical method in three general phases.
First, historians scour physical and digital archives in search of sources like diary entries, artifacts of clothing, first-hand interviews, or fugitive slave advertisements to obtain a solid idea of what the past was really like. These are primary sources: contemporary accounts created by people who were present or intimately involved in historical events.
In the second phase of the historical method, historians critically read scholarly articles and books to stay up to date on how their peers have interpreted the same subject. Books and articles are two prime examples of secondary sources. They offer valuable context and fresh insight into historical events after those historical events have ended.
Thirdly and finally, historians place it all in conversation with each other. The sources they discovered in the archive inform and are informed by the secondary source reading they have completed. The result is a more accurate and inclusive telling of the past.
The Historical Method and the Digital World
The same analytical habit of critically reading one’s sources can also be used by students to navigate the digital landscape—the ever evolving and full scope of information accessible through media, online, via applications and social media. Indeed, the historical method can be usefully translated by educators to help students become critical clickers . That is, students who are responsible online researchers and who are adept at distinguishing reliable information from misinformation .
Many archives in the United States are free and publicly accessible, scholarly books are widely published, and an increasing amount of information is openly available online. But, ironically, because nearly anyone in the world can publish information on the Internet, the digital landscape can be a dangerous place to conduct historical research. With misinformation around every corner, how do historians navigate the digital landscape?
“The very nature of information on the Internet requires a shift in the way we evaluate the credibility and worthiness of the information we encounter.” ~ Christy Coleman , on Reframing History
Unlike the materials one finds in the archive, the Internet is an unregulated space. Not every website found online is subject to a vetting process. So, in addition to critiquing the validity of a single document online, deciphering the veracity of online databases and repositories can be extremely tricky. But how studying historical research methods aid educators in helping students to alternate between critical reading and critical clicking ?
Some sites are clearly trustworthy. The National Archives and Records Administration or the Library of Congress are two great examples. Just as some digitally accessible academic and government organizations are certainly reliable: articles published in the American Historical Review and the Journal of African American History, or content from the National Park Service .
But other websites and resources trigger more skepticism. And they must be questioned on a case-by-case basis. Some questions can be answered before the researcher even clicks on a link. Upon launching a question in a search engine, historians can begin to gauge the reliability of a website. What is the ending of the URL? Is it a “.com,” “.org,” “.gov,” or a “.edu” site? But sometimes these inquiries are too superficial to separate an unreliable website from a reliable one . In our current digital age, merely confirming the author of an article or the publisher of a website is not enough to combat misinformation.
Just like with a physical primary source, the researcher must cross-examine the website. When faced with an unknown resource, online researchers (who are also critical clickers) investigate other websites to determine whether a source is reliable. This method is known as “lateral reading.” Similarly, historians of the Underground Railroad search for plantation records or correspondence to see how a fugitive slave advertisement fits into a history of freedom seeking. The practice of cross-examination is honed through the historical research method becomes invaluable in combatting online misinformation.
Students are sure to find other examples of how the historical research method can aid in combatting online misinformation as they work their way through this lesson plan. Indeed, one of the main goals of this lesson plan is to foster a curiosity equipped with critical clicking.
D1.5.9-12. Determine the kinds of sources that will be helpful in answering compelling and supporting questions, taking into consideration multiple points of view represented in the sources, the types of sources available, and the potential uses of the sources.
D2.His.11.9-12. Critique the usefulness of historical sources for a specific historical inquiry based on their maker, date, place of origin, intended audience, and purpose.
D2.His.12.9-12. Use questions generated about multiple historical sources to pursue further inquiry and investigate additional sources.
This lesson is designed to introduce students to primary source analysis. There are no prior concepts that students need to review before implementing this lesson plan.
However, it may be useful for teachers to review the modeling key for activity three (below) and to read / listen to: “The Case of the Misunderstood Historical Method,” from Reframing History, produced by the American Association of State and Local History.
Activity 1: Defining primary and secondary sources
Begin by reading the Understanding Primary and Secondary Sources handout independently, in small groups, or with the entire class. This brief document uses engaging language to articulate the key differences between primary and secondary sources. It also poses some common questions that historians ask of primary and secondary sources in order to fully comprehend their value and context. A group discussion is encouraged.
“Understanding Primary and Secondary Sources” ends with a prompt: If a historian in 2075 wanted to study classrooms in 2023, what objects around us would serve as excellent primary sources in their research? Answers may range, although some common responses might include: desks, chairs, pens, pencils, markers, projectors, lockers, worksheets, textbooks, and school uniforms. Educators then end by reiterating and emphasizing what primary sources add to an individual’s historical research.
Activity 2: Identifying Primary Sources
In groups of 3-4, students test their understanding of primary and secondary sources by completing the Matching Primary and Secondary Sources worksheet. In this exercise, they are tasked with correctly labeling 10 sources as either primary or secondary sources. Students will identify the specific information that helped them arrive at their answers. A key with explanations for each of the sources included in the lesson plan materials. After work time, review answers as a class and invite students to share their reasoning.
Activity 3: Introduction to Primary Source Analysis
The educator is supplied with two fugitive slave advertisements and is tasked with modeling for the entire class the critical thinking that goes into analyzing a primary source using a graphic organizer. The intellectual life for analyzing the first advertisement and filling in the graphic organizer should be on the educator. The educator should guide students through the second advertisement; however, students should supply the majority of the analysis. An exemplar graphic organizer with key words & phrases to model the thinking is supplied for the educator in the lesson plan materials.
After the full-class discussion and analysis, students then transition to small groups to analyze different fugitive slave advertisements together. They will be given two to three fugitive slave advertisements observe and analyze, while also putting their thoughts into the graphic organizer.
Prompt: You are explaining the Underground Railroad and the stories of freedom seekers to a friend. Choose three (3) primary and three (3) secondary sources from the lists below that you think would be most effective at explaining what it was. Write a three-paragraph response that explains your reasoning for choosing your primary and secondary sources.
Materials & Media
Understanding primary and secondary sources, matching primary and secondary sources, primary source analysis, primary source analysis graphic organizer, related on edsitement, unveiling the past: analyzing primary documents on harry washington's life, lesson 2. “read all about it”: primary source reading in “chronicling america”, ask an neh expert: validating sources, visual records of a changing nation.
- DOI: 10.54919/physics/56.2024.0fer1
- Corpus ID: 271144563
The development of research skills in physics laboratory works of secondary school students in an information and education environment
- Nazym Zhanatbekova , Yerlan S. Andasbayev , +2 authors Farzana Boribekova
- Published in Scientific Herald of Uzhhorod… 21 April 2024
- Physics, Education
Related Papers
Showing 1 through 3 of 0 Related Papers
Thank you for visiting nature.com. You are using a browser version with limited support for CSS. To obtain the best experience, we recommend you use a more up to date browser (or turn off compatibility mode in Internet Explorer). In the meantime, to ensure continued support, we are displaying the site without styles and JavaScript.
- View all journals
- Explore content
- About the journal
- Publish with us
- Sign up for alerts
- Open access
- Published: 31 August 2024
A measurement model of pedestrian tolerance time under signal-controlled conditions
- Xinghua Hu 1 ,
- Nanhao Wang 2 ,
- Jiahao Zhao 1 ,
- Xiaochuan Zhou 3 &
- Bing Long 4
Humanities and Social Sciences Communications volume 11 , Article number: 1116 ( 2024 ) Cite this article
Metrics details
- Science, technology and society
The tolerance of pedestrians to red light signals is a crucial factor in urban residents’ travel experiences and road traffic safety. To address the current lack of research on methods for measuring pedestrian red light tolerance time at crossings, this paper proposes a stacking model for predicting the red light tolerance time of individual pedestrians. The model employs the XGBoost (XGB), random forest (RF), support vector machine regression (SVR), and multilayer perceptron (MLP) models as primary models, with a multiple linear regression model as the secondary-layer meta-model, as well as Bayesian hyperparameter tuning. Using random survival forest (RSF) and K-means clustering methods, the dataset was divided into three categories: the low, medium, and high tolerance groups. The feature variables influencing the red light tolerance time were grouped accordingly. Stacking models were established for each tolerance and feature group. The experimental results demonstrated that the feature group voted on by multiple machine learning models performed the best in all three tolerance groups. In the low tolerance group, the mean squared error (MSE), mean absolute error (MAE), and mean absolute percentage error (MAPE) were 6.58, 1.91, and 19.78%, respectively. For the medium tolerant group, the MSE, MAE, and MAPE were 4.82, 1.53, and 7.63%, respectively. For the high tolerance group, the MSE, MAE, and MAPE were 33.32, 3.89, and 10.14%, respectively. Individual XGB, RF, SVR, MLP, and ungrouped stacking models were established for comparative analysis of the test set. The results indicated that the proposed grouped stacking model outperformed the other models overall. The method provides a means of obtaining the probability distribution function of the length of the waiting crowd’s tolerance time for each red light range and thus determining the duration of the red light at the crossing signal for different personnel compositions.
Evaluating the pedestrian level of service for varying trip purposes using machine learning algorithms

Identifying high crash risk segments in rural roads using ensemble decision tree-based models

Risky lane-changing behavior recognition based on stacking ensemble learning on snowy and icy surfaces
Introduction.
With increasing emphasis on environmental protection and concerns about carbon emissions, the need to reduce fossil fuel usage and air pollution has become evident. Consequently, the promotion of low-carbon transportation modes, such as walking, has become widely accepted. Walking is not only a primary green transportation mode but also plays a crucial role in connecting urban public transportation systems. However, the prevailing approach to urban development, which prioritizes motorized traffic, has resulted in a multitude of challenges pertaining to the quality of pedestrian environments and the adequacy of pedestrian facilities in urban areas. In particular, the parameters utilized for controlling traffic signals at crossings are often based on aggregated pedestrian walking speeds. These estimates are often insufficiently refined and lack flexibility, as they seldom account for the diverse quantitative characteristics of pedestrians, including their varying tolerance for the length of red signal times. This has resulted in the phenomenon of pedestrians remaining at red lights for extended periods beyond their tolerance time, with some pedestrians crossing illegally during red lights. This has a significant impact on the safety and experience of pedestrians crossing the street. This results in excessively long pedestrian red light signals in many cities, severely affecting pedestrian crossing safety and experience. Research has indicated that pedestrians who ignore red lights are more likely to be injured (Ghadirzadeh and Rassafi, 2022). According to a 2023 report by the World Health Organization (WHO), pedestrian crossing accidents account for 23% of all pedestrian casualties. Therefore, studying pedestrian red light tolerance time and its influencing factors is of great significance for promoting low-carbon travel and pedestrian safety.
This study considered the start of the red light within a signal cycle as the observation starting point and the end of the green light as the observation endpoint, defining this as an observation cycle. This cycle was repeated multiple times and the results were summarized statistically. As shown in Fig. 1 , the pedestrian states are classified as k1, k2, and k3. State k1 indicates that the pedestrian arrives at the intersection during the green light and starts crossing normally during the green light. State k2 indicates that the pedestrian arrives at the intersection during the red light and waits until the green light before crossing the intersection. State k3 indicates that the pedestrian arrives at the intersection during the red light and starts crossing illegally during the red light.

Different types of pedestrian crossings.
The pedestrians in scenarios k1 and k2 both cross under a green light, which is considered normal crossing. In scenario k1, pedestrians do not experience any waiting; thus, this is not the primary focus of this study and will not be discussed further. In scenario k2, only the starting point of the pedestrian waiting tolerance is observed, whereas the endpoint of the tolerance is not. This is because the green light turns on before the pedestrian reaches their tolerance limit, resulting in an early end of the waiting period. Consequently, we cannot determine how long the pedestrian could have tolerated waiting if the green light had not been turned on. This unobserved “excess” red light tolerance time cannot be measured. We only know that their red light tolerance time is at least as long as the remaining red light time upon their arrival, but we cannot determine their actual full red light tolerance time (this type of data is also known as “censored” data). Because of the lack of completeness, these pedestrian data are only meaningful for categorizing pedestrian tolerance types and cannot support specific predictions of red light tolerance time. Therefore, this study includes k2-type normal crossing pedestrians in the tolerance types analysis but does not make specific time predictions.
In scenario k3, pedestrians cross the road during the red light, which is illegal crossing behavior. In this scenario, both the starting point of the pedestrian’s waiting tolerance and the endpoint where the pedestrian reaches the tolerance limit and illegally crosses (runs a red light) are observed within an observation cycle. The complete red light tolerance time for a pedestrian can be calculated using these two time points. This study primarily focuses on predicting the red light tolerance time for this type of pedestrian. The goal is to accurately predict the red light tolerance time of each individual pedestrian to calculate the dynamic waiting tolerance time for each group of waiting pedestrians, thus helping to rationalize the signal timing and convert more k3-type illegally crossing pedestrians into k2-type normally crossing pedestrians.
Pedestrian red light tolerance time studies can generally be divided into three categories: those that focus on factors affecting pedestrian red light tolerance time, numerical studies on pedestrian red light tolerance time, and studies on the selection and establishment of models for pedestrian tolerance time. The current research primarily focuses on exploring the external characteristics of pedestrians and the environmental factors that affect them. Existing studies have shown that pedestrian age, gender, walking speed, type of crossing, and group size affect red light tolerance time (Kumar and Ghosh, 2022 ; Shaaban and Abdelwarith, 2020 ; Xing et al., 2022). Moreover, as technology has developed, new influencing factors affecting pedestrian red light tolerance time have been identified, such as pedestrians being distracted by mobile phones or other activities during the red light period (Long et al., 2022). Cui et al. ( 2022 ) discovered that pedestrians who could see a clear countdown were less likely to run a red light because of the reduced anxiety from waiting. However, the same influencing factors can have different effects at different intersections (Chen et al. 2023 ).
Further analysis of pedestrian red light tolerance time suggests that even under different circumstances and regions, a degree of difference exists in pedestrian red light tolerance time. Asaba and Saito ( 1998 ) showed that, in Japan, pedestrians could tolerate a maximum waiting time of 40–60 s, with anxiety starting to increase between 21 and 28 s. Zhang et al. ( 2016 ) proposed an ideal pedestrian red light tolerance time of 18.7 s, with a limit of 52.8 s. Furthermore, Jain et al. ( 2014 ) indicated that approximately 20% of pedestrians have zero waiting tolerance time.
From the model establishment perspective, many studies have used deterministic models such as logistic regression (Ghadirzadeh et al. 2020 ; Tian et al. 2022 ). Although these models are easy to implement and interpret, their accuracy depends on data quality, which may lead to a poor fit with average data quality, and they do not consider the impact of pedestrian crossing data censoring. To address the impact of data censoring, many studies have opted for traditional survival analysis models originally used in the medical field to study patient survival times when handling censored data. Hamed ( 2001 ) applied survival analysis to study the distribution of waiting times and crossing attempts, and explored the relationship between waiting time and crossing behavior. Tiwari et al. ( 2007 ) analyzed pedestrian crossing behavior using survival analysis and obtained Kaplan–Meier survival charts for waiting times. However, these nonparametric duration models cannot quantify the impact of the influencing factors on the probability of running the red light or consider the impact of covariates on red light tolerance time. Other studies have combined traditional survival analysis with the Weibull distribution to create fully parametric models for analysis (Dhoke et al. 2021 ; Liu et al. 2022 ); however, these require the distribution of survival times to follow the Weibull distribution, which is not always the case for pedestrian red light tolerance time, leading to reduced model accuracy in practice.
Recently, combining deep learning with survival analysis has been proposed, offering an effective method for identifying nonlinear relationships without making assumptions about the data and fitting real-world pedestrian crossing scenarios more closely. However, this approach has not been widely mentioned or used in pedestrian crossing research, and its practical applicability in real-world scenarios has not been fully verified. Arash and Bilal (2019) introduced the Deep Wait deep learning framework to predict pedestrian red light tolerance time under uncontrolled signal conditions using virtual reality technology-simulated data. However, this framework does not consider many factors that influence real-world pedestrian red light tolerance time.
Despite the extensive and in-depth research conducted by scholars in the field of pedestrian crossing time analysis, there are still some shortcomings in existing studies.
First, most studies have focused on macro-level factors influencing pedestrian red light tolerance time and the distribution of red light tolerance time for groups, lacking prediction methods for the red light tolerance time of individual pedestrians based on their micro-level characteristics.
Secondly, current studies generally use a single model for prediction, whereas the factors influencing red light tolerance time are complex and varied. Therefore, a comprehensive analysis from different perspectives, using multiple models, is necessary.
Third, pedestrian classification has not been considered. Different types of pedestrians may be affected differently by the same factors; therefore, it is essential to classify pedestrians based on their tolerance-related characteristics.
It is currently challenging to accurately represent the length of individual crossing times that are tolerant to delays by employing large time granularity as the statistical cycle. Furthermore, it is difficult to reflect the distributive characteristics of tolerant times by utilising the average value and other fixed parameters, which cannot provide a foundation for the dynamic timing of pedestrian crossings. To address these issues, this paper employs machine learning algorithms to estimate the waiting tolerance time of each pedestrian under signal control conditions. Its main work is as follows:
Establishment of quantitative pedestrian tolerance classification standards and models. This study designs specific prediction models for different types of pedestrians to improve prediction accuracy.
To address the issue of manually setting hyperparameters in machine learning models that often do not achieve global optimization, this study introduced Bayesian automated hyperparameter optimization to enhance the predictive performance and generalization ability of the models.
Proposal of a stacking ensemble model for predicting individual pedestrian red light tolerance time. This method is divided into two layers. The first layer uses the XGBoost (XGB), random forest (RF), support vector machine regression (SVR), and multilayer perceptron (MLP) models. The secondary-layer uses a multiple linear regression (MLR) model as meta-model.
Model building
Overarching framework.
Models of this study require a dataset that includes features such as pedestrian gender, age, environmental conditions, and traffic conditions. It also requires two labels: the red light tolerance time and the “running the red light” event state variable. This study established a two-layer stacked model combined with Bayesian hyperparameter optimization(BOA) for predicting the grouping of pedestrians based on different tolerance types. The primary models include the following machine learning and deep learning regression models: XGB, RF, SVR, and MLP. The secondary-layer meta-model is the MLR. The main steps of this study are as follows:
Step 1: Preprocess the collected pedestrian crossing dataset to remove outliers and noise.
Step 2: Use a random survival forests (RSF) model to output the risk score for each pedestrian and use K-means clustering to categorize the pedestrian tolerance groups.
Step 3: Select and group features from multiple perspectives, and use the different grouping results as feature inputs for the Stacking model.
Step 4: Split the classified pedestrian data from Step 2 into training and testing sets.
Step 5: Establish XGB, RF, SVR, and MLP primary models for different tolerance groups. Train the models with the training set using five-fold cross-validation and use the BOA algorithm to tune the model parameters. Then, output the results of the primary models.
Step 6: Integrate the prediction results of the primary models with the actual pedestrian crossing values to form new training and testing sets. Then, input these sets into the secondary-layer MLR meta-model and output the final prediction results.
The overall framework of the model is shown in Fig. 2 .

The framework includes basic modules for pedestrian grouping, hyperparameter optimisation, feature filtering and grouping, and numerical prediction.
Model design
Rsf-based classification of pedestrian red light tolerance types.
This study employed an RSF model to group the waiting tolerances of pedestrians under signal conditions. The RSFs utilize an ensemble tree method to study censored survival data. Compared to traditional models, the RSF method is a nonparametric model, and its advantage in predicting pedestrian crossing waiting times under signal-control conditions lies in its effective handling of complex survival data without requiring many assumptions. Randomness and ensemble methods endow it with strong generalization capabilities. Several classic algorithms are commonly used for clustering, such as K-means, mean shift, DBSCAN, and expectation maximization (EM) clustering using Gaussian mixture models (GMM). In this study, owing to its fast computation, simplicity, and ease of manually determining the number of clusters, the K-means algorithm is employed to group the pedestrian tolerance types. The division process is illustrated in Fig. 3 . First, pedestrian data were categorized and labeled as normal crossing (k2) or illegal crossing (k3). Then, the data were input into an RSF to obtain different pedestrian risk scores, which further guided clustering into different pedestrian types.

Segmentation process for the three pedestrian tolerance subgroups.
In the RSF model, there are two important concepts: survival time and death events. Survival time refers to the duration from the beginning of the observation period until the occurrence of a death event or the end of the observation period. A death event is an event that is predefined by the observer, and once it occurs, the sample transitions from a survival state to a death state. In the context of pedestrian red light tolerance, the behavior of “running the red light” during a signal cycle is defined as the death event in the model. Therefore, pedestrian samples categorized as k2 (normal crossing) that do not exhibit this event are marked as “surviving” samples, while those categorized as k3 (illegal crossing) are marked as “death” samples. The time from when a pedestrian arrives at an intersection and waits until they begin to cross the street is defined as the survival time in the model. The central elements of the algorithm are the generation of the survival tree and the construction of the integrated cumulative hazard function (CHF). A survival tree is a binary tree generated by recursively splitting tree nodes. A tree is grown from the root node, which is the top of the tree containing all the pedestrian crossing data. Using a predetermined survival criterion, the root node is divided into two child nodes, a left child node and a right child node, into which the pedestrian data are assigned. Sequentially, each child node is split, with each split creating left and right child nodes, and the pedestrian data are divided individually. By maximizing the survival variance, the tree separates different cases. Eventually, the surviving tree reaches a saturation point when no new child nodes can be formed. The most terminal node in the saturated tree is called the leaf node and is denoted as H . For a single survival tree, the cumulative risk function of individual i at leaf node h is as follows:
where \({X}_{i}\) ( \(i\) =1,2,3……) denotes the selected feature covariates affecting pedestrian sample \(i\) . t denotes the survival time. \({t}_{i,h}\) denotes the point in time at which the i th pedestrian in leaf node h is located \(.\) d i,h denotes the number of fatalities at moment \({t}_{i,h}\) . and \({s}_{i,h}\) refers to the number of people who survived at moment \({t}_{i,h}\) .
The cumulative risk function is derived from a single tree only. The RSF is necessary for calculating the integrated cumulative risk function by averaging over multiple surviving trees, assuming that the total number of surviving trees is N . The model randomly draws samples of the original data in the form of putbacks to create a subset of the samples, excluding 37% of the data in each sample as out-of-the-bag (OOB) data and the remaining data as in-the-bag (IB) data. The integrated cumulative risk function for the i th pedestrian from the OOB across all survival trees is as follows:
where \(n\) denotes the n th survival tree in the random survival forest. \({H}_{n}^{* * }\left(\left.t\right|{X}_{i}\right)\) denotes the cumulative risk function of the n th survival tree outside the bag. When the sample contains out-of-bag data, \({I}_{i,n}\) = 1; otherwise, \({I}_{i,n}\) = 0
The integrated cumulative risk function for the i th pedestrian from the IB data across all the surviving trees is as follows:
where \({{H}^{* }}_{n}\left(\left.t\right|{X}_{i}\right)\) denotes the cumulative risk function of the n th surviving tree in the bag.
The nature of the survival tree and its integration suggest an estimate of pedestrian mortality. The integrated mortality for the i th pedestrian sample from the OOB is defined as follows:
where \({H}_{e}^{* * }({T}_{j}|{X}_{i})\) denotes the integrated cumulative risk function of the i th pedestrian from the OOB across all the surviving trees. J denotes the total number of pedestrian samples in the non-bootstrapped data. \({T}_{j}\) denotes the survival time of the j th pedestrian sample in the non-bootstrapped data.
The integrated mortality of the i th pedestrian sample from the IB data is defined as follows:
where \({H}_{e}^{* }({T}_{j}|{X}_{i})\) denotes the integrated cumulative risk function of the i th pedestrian from the IB across all the surviving trees.
The calculated mortality is referred to as the risk score.
Furthermore, in this study, the contour coefficient method is used to verify the optimal number of clusters for the pedestrian red light tolerance type. The contour coefficient is the core metric of the contour coefficient, as expressed in Eq. 6 . The basic assumption is that the similarity between the samples can be measured by distance proximity, which is based on the distance between the samples, closeness of the samples in the cluster, and separation from other clusters. S takes a value between [−1,1], the closer the value is to 1, indicating that the sample points are less distant from the samples of the same cluster and more distant from the samples of other clusters, the better the clustering effect. However, when the contour coefficient is close to −1, it indicates that the distance between the sample and the same cluster sample is large, and the distance between the sample and other cluster samples is small. In this case, the clustering effect is poor. Unlike the elbow method which requires subjective determination of the optimal number of clusters by observing the slope change, the contour coefficient method provides a more accurate and clear measure for determining the optimal number of clusters.
where \({D}_{{\rm{a}}}\) denotes the average Euclidean distance between the sample point and all other points in the same cluster, i.e., the similarity between the sample point and other points in the same cluster, and \({D}_{{\rm{b}}}\) denotes the average Euclidean distance between the sample point and all points in the next-nearest cluster, i.e., the similarity between the sample point and other points in the next-nearest cluster.
Finally, this study utilized the risk score output from the RSF results of different pedestrian red light tolerance-type numerical labels obtained after calculation using the K-means algorithm and further divided the dataset based on the labels.
Stacking model
The overall structure of the stacking integration model used in this study is shown in Fig. 4 . The stacking model was divided into two-layer, with XGB, RF, MLP, and SVR selected as the primary models in this study, while MLR was selected as the secondary model. The segmented pedestrian dataset in this study was input into the primary model using 5-fold cross-validation to mitigate the risk of data leakage that may occur in the stacking model. The four primary models made predictions independently, and the predictions of the models as \({\hat{p}}_{1}\) , \({\hat{p}}_{2}\) , \({\hat{p}}_{3}\) and \({\hat{p}}_{4}\) were integrated. The predictions of the primary models were integrated as a set of features as \(\hat{p}\) , and the pedestrian’s red light tolerance time was realized as \(y\) . \(\hat{p}\) and \(y\) were stitched together to form a complete dataset for use as input for the secondary-layer meta-model. Finally, the secondary-layer MLR meta-model outputs the prediction results for pedestrian tolerance time. This approach avoids overfitting, learns information regarding the combination of features, and improves prediction accuracy.

Stacking model with four primary set models and one secondary model.
Figure 5 shows the specific algorithmic framework of the stacking model. The main steps of which are described as follows:

The specific algorithmic framework and main steps of the stacking model.
Step 1: Divide the input dataset into training and testing datasets at an 8:2 ratio.
Step 2: Divide the training set into five folds (training i sub-dataset, i = 1,2,3,4,5). In each training set, select four folds as the training set and the remaining 1 fold as the validation sub-dataset.
Step 3: Combine different training sets according to the segmentation results in Step 2 and train Model i ( i = 1,2,3,4,5). Model i is used to predict the validation sub-dataset of the corresponding group and to obtain a one-fold one-dimensional prediction sequence validation prediction i (column vector, i = 1,2,3,4,5). Simultaneously, use Model i to predict the testing dataset, a one-fold one-dimensional prediction sequence testing prediction i (column vector, i = 1,2,3,4,5). This is repeated until all the combinations are traversed. Finally, we obtain five validation predictions i and five testing predictions i .
Step 4: Combine the five validation predictions i into a one-dimensional prediction sequence, obtain a new training feature j (the length is the same as the training dataset, j = 1,2,3,4). The five testing predict i are averaged to obtain a prediction sequence new test feature j (the length is the same as the length of the testing dataset, j = 1,2,3,4).
Step 5: Repeat Step 3 and Step 4 using the RF, MLP, SVR, and XGB models, and finally obtain four new training features j and four new test feature s j . The four new training feature s j and the corresponding true value column (Train y ) of the training set are merged horizontally to obtain a new training data, and the four new test feature s j and the corresponding true value column (Test y ) of the test set are merged horizontally to obtain a new test data.
Step 6: Use the MLR model to train and derive the final predicted red light tolerance time based on the new test set obtained in Step 5 and the training set.
Stacking primary model with BOA parameter tuning
In the stacking integration model for the prediction of red light tolerance time for individual pedestrians, the following two principles should be observed for the selection of primary models: (1) select models that can learn sufficiently from the training data, with good generalization and fitting abilities; and (2) reduce the collinearity of the prediction results of pedestrian red light tolerance time from each primary model as much as possible to improve the final prediction accuracy of the secondary meta-model. In this study, we chose to establish four regression models, RF, XGB, MLP, and SVR as the primary models, mainly because the above four models have significant differences in construction principles and modeling theories. As a result, the problem of excessive collinearity in the model results was reduced. At the same time, the above models can adequately fit the data in the training set.
The principles of the four models are as follows:
Random forest is an integrated learning algorithm that combines multiple regression trees. The single regression tree construction process is as follows:
Step 1: Randomly select a subset of all features as candidate features.
Step 2: Using the selected candidate features, select the optimal split point based on the residual sum of squares (RSS). The RSS is a measure of the consistency of the pedestrian sample values within a node, and its goal is to select the split point that causes the split node to have the smallest RSS. A given node \(G\) can be expressed as follows:
where \(\left|G\right|\) is the number of pedestrian samples in node \(G\) . \({y}_{i}\) is the true value of the red light tolerance time of pedestrian sample i . \(\bar{y}\) is the mean red light tolerance time of all pedestrians in node \(G\) .
For node \(G\) , all possible split points (features and their values) were considered, the RSS( G ) of the two child nodes \({G}_{{\rm{L}}}\) and \({G}_{{\rm{R}}}\) generated after the split was computed, and the split point that minimized the overall RSS after the split was selected. The overall RSS is defined as
where ∣ \({G}_{{\rm{L}}}\) ∣ and ∣ \({G}_{{\rm{R}}}\) ∣ are the number of samples in the left child node \({G}_{{\rm{L}}}\) and the right child node \({G}_{{\rm{R}}}\) , respectively.
Step 3: Repeat the above process until the number of samples in each node is less than a preset threshold or all samples belong to the same category.
Multiple-regression trees were constructed using the aforementioned process to form a random forest. This algorithm uses the voting mechanism of multiple regression trees to average the pedestrian red light tolerance time predictions of multiple trees and obtain the final result. The prediction result of the random forest regression can be expressed as follows:
where \({\hat{y}}_{i}\) denotes the predicted value of the red light tolerance time of pedestrian sample i . M is the number of regression trees in the random forest. \({t}_{i,m}\) is the predicted result of the m th regression tree for the red light tolerance time of the i th pedestrian.
The XGB model is used to predict the pedestrian crossing red light tolerance time based on the gradient boosting technique, which improves the overall performance by serially training multiple regression tree models and combining their predictions of pedestrian tolerance time. This iterative process allows the model to gradually approximate the true value of the pedestrian red light tolerance time and minimize the loss function. Assuming that the model has K regression trees, its core formula can be expressed as follows:
where \({L}_{{\rm{Obj}}}\) represents the objective function of the XGB model. B is the number of input pedestrian samples. The regression equation is established by the k th tree of \({f}_{k}\) . \({f}_{k,i}\) denotes the result obtained from the regression equation built using the k th tree for the i th pedestrian. \(\varOmega \left({f}_{k}\right)\) contains the regularization term. \(L\left({y}_{i},{\hat{y}}_{i}\right)\) is the model loss function, which is computed using the mean-square error (MSE) formula. The formula can be expressed as follows:
In this study, we used L1 and L2 regularization terms with the following specific expressions:
where T is the number of leaf nodes of the tree, and γ is the penalty coefficient for the term. The L1 regularization term parameter is α , and the L2 regularization term parameter is λ . \({{\omega }}_{{j}}\) is the weight of the j th leaf node. During the training process, the XGB model optimizes the objective function using gradient descent and continuously adjusts the model parameters to minimize the loss function.
The main algorithm flow of MLP model is as follows:
Step 1: Forward propagation. The network receives the input pedestrian sample data and processes them through the node-weighted sum of each layer and the activation function, which is passed from the input layer to the hidden layer, and finally to the output layer. In this study, the hidden layer uses the ReLU activation function, which is a nonlinear function that directly outputs the value when the input is greater than 0, and 0 when the input is less than or equal to 0. When the input is negative, the derivative of the ReLU function is 0, and when the input is positive, the derivative of the ReLU function is 1. When the value of the input is 0, the ReLU function cannot be derived.
Step 2: Loss calculation. The error between the predicted and actual results is calculated at the output layer. The MSE is used for the loss function (as shown in Eq. 12 ).
Step 3: Backward propagation of Errors. The loss gradient with respect to each weight is calculated backward from the output layer.
Step 4: Weights update. All the weights and biases in the model are updated based on the calculated gradients, and the set learning rate. The values of the reduced loss function are updated using stochastic gradient descent.
The above steps are performed in a loop, with each iteration aimed at reducing the value of the loss function until the specified number of iterations is reached or the loss value no longer decreases significantly. A prediction is made based on the final weight combination obtained.
Support vector machine regression (SVR) is a type of support vector machine (SVM). Its goal is to find a prediction function f(x ) with a specified margin of tolerance on either side of the function, where no loss is computed for all the pedestrian samples falling within it. Only the samples falling outside the region contribute to the loss function. Later on, the model is optimized by minimizing the intervals between the width of the band and the total loss to optimize the model. The SVR model is shown in Fig. 6 . The specific process is as follows:

Schematic representation of the principle of the SVR model in the primary model.
First, the regression formula for the predicted value of pedestrian red light tolerance time can be expressed as follows:
where \(\hat{y}\) denotes the predicted value of the pedestrian red light tolerance time. X is the input feature vector. \(\omega\) is the weight vector, and \(b\) is the bias term.
Second, an insensitive loss function ε is introduced to ignore the part of the error that is smaller than ε . The loss function is expressed as follows:
Finally, slack variables \(\xi i,{\xi i}^{* }\) are introduced into the model, and the model weights are optimized by minimizing the objective function as follows:
where C is the regularization penalty coefficient.
In this study, the BOA method was used for the hyperparameter tuning of the four primary models, and the BOA global optimization algorithm was applied to speed up the model-iteration process. In each iteration, the BOA selects candidate points from the hyperparameter space based on the current probabilistic model and sampling method. These candidate points are considered as hyperparameters for the MLP, XGB, RF, and SVR models, which are used to construct the model and train it on the training set. The effectiveness of the models is evaluated by calculating their performance indices on the validation set, which is used as a target output function for updating the probabilistic model and sampling method. This process is repeated until a predetermined number of iterations is reached or the target performance index is achieved. At the end of each iteration, the hyperparameters of the model with the best performance are selected. The selected hyperparameters are used to construct the MLP, XGB, RF, and SVR models for the entire training set. Finally, the performance of the models is evaluated using the test set, and the best predicted data are obtained. The advantages of the BOA algorithm are its ability to obtain a solution that is close to the global optimal solution regardless of the data size and that it can determine the optimal solution in only a few iterations. The optimization range is shown in Table 1 .
2.2.4 Stacking meta-model
The stacking meta-model for pedestrian red light tolerance time prediction should use a simpler model to prevent overfitting in the final prediction results of the integrated model. Multiple linear regression is a linear regression problem in which a sample has multiple feature. In this study, the prediction results of the four primary models for pedestrian red light tolerance time were used as four features ( \({x}_{1},{x}_{2},{x}_{3},{x}_{4}\) ). The expression for the predicted value is:
where \({w}_{0}\) is the intercept of the model, and \({w}_{1}\) – \({w}_{4}\) are the regression coefficients. \({x}_{i1}\) – \({x}_{i4}\) are the predicted values belonging to the different primary models for the i th pedestrian sample. Assuming that q samples exist in the subset divided by the pedestrian dataset, this equation can be represented using a matrix with an input feature structure of ( q ,4). It is expressed as follows:
The multivariate linear regression model in this study used the MSE as the loss function (Eq. 12 ). According to the above expression, the optimal regression coefficients were derived using the gradient descent method.
Data-driven model-based instantiation and result analysis
Pedestrian crossing measurement data.
The data for this study were collected from three signal-controlled crosswalks in Chongqing, China. Site 1 was located at an intersection in the Wanshicheng commercial area in Jiulongpo District, Site 2 was located inside the Longhu commercial area in Yuzhong District, and Site 3 was located at 122 Shixiao Road in Shapingba District. The selected sites were all located in the city center and were characterized by high pedestrian density. The data were collected from September 12 to 29, 2023 on sunny days to exclude interference from weather conditions. The appropriate time period was selected as 7:00 to 20:00 every day for video recording and collection, and the video was recorded at a rate of 60 f/s. The pedestrian crossing signal timings at each location are listed in Table 2 .
The collected data included the pedestrian waiting time, individual pedestrian characteristics, and environmental factors. Pedestrians arriving at the intersection were the starting points of timing, and pedestrians starting to cross the street were the end points of timing; the pedestrian’s red light tolerance time was calculated through the two time points. Individual characteristics included pedestrian gender, age, distraction state, and walking speed. The distraction status refers to whether the pedestrian is communicating with others, looking at a cell phone, taking care of children, or engaging in other distracting behaviors. In addition, the group size indicated whether the pedestrian was waiting alone or in a group. The time attribute indicated whether it is daytime or night. The violators status indicated whether other pedestrians were crossing the street with a red light in front of the observed pedestrians. Pedestrian volume indicated the degree of congestion at an intersection at a given time.
Data preprocessing was performed to detect and remove duplicate or vacant data in the dataset. The value range of pedestrian red light tolerance time was set as 5–105 s, beyond which outliers were deleted. The outliers in the red light tolerance time were detected using the isolated forest method, and further determination was made regarding whether they could be retained or not.
By deleting 27 pieces of data through the above preprocessing, 1223 pieces of normal crossing data and 1527 pieces of illegal crossing data were obtained. The data slices are listed in Table 3 , where columns 1–8 show the features. The 9th column is the measured value of the pedestrian red light tolerance time. The last column is the event status variable, the value of 0 indicates that the pedestrian did not “run the red light” and the value of 1 indicates that the pedestrian ran the red light across the street.
Descriptive statistics for the illegal crossing data behavioral variables are presented in Table 4 . We found that 59.5% of the total pedestrians were male. Prime age accounted for 59.2%, whereas underage and elderly accounted for 15.3% and 25.5% of the dataset, respectively. Over half of the observed pedestrians were distracted, such as looking at cell phones and chatting, 60.4% of the time.
Pedestrians traveling alone accounted for 55.7% of the total population. In the state of pedestrian volume, loose traffic accounts for 35.4%, moderate traffic accounts for 30.3%, and crowded traffic accounts for 34.3%. 71.1% of the observed recorded data came from the daytime. The walking speeds of pedestrians are categorized into low, medium, and high, accounting for 29.3, 38.6, and 32.1%, respectively. The number of violators in front of pedestrians was 37.5%. Note the above characteristics in the order as \({i}_{1}\) , \({i}_{2}\) , …… \({i}_{8}\) .
Pedestrian crossing tolerance grouping
Pedestrian risk scores reflect the degree to which each pedestrian sample is likely to lose patience during a red light and thus cross the street during a red light event. Specifically, pedestrians with higher risk scores were less tolerant and prone to red light crossing events in a shorter period of time. Pedestrians with lower risk scores were more tolerant and tolerated longer periods. A frequency plot of the risk scores obtained from the RSF model is shown in Fig. 7 . The resulting risk scores for each pedestrian were used as inputs for the K-means algorithm. According to the results of the contour coefficient method, The number of clusters was determined as 3, as shown in Fig. 8 . The output of the three types of pedestrian red light tolerance and the corresponding numerical labels from to 1–3 were low, medium, and high tolerance. Combined the results of multiple clustering analyses to determine the category for each pedestrian, as shown in Fig. 9 . Based on this result, the original illegal crossing data were divided into three sub-datasets, and the model was trained for prediction. There were 553, 452, and 522 data points in the low, medium, and high tolerance groups, respectively.

Distribution of pedestrian crossing risk scores.

Results of the contour coefficient method for identifying the number of pedestrian tolerance subgroups.

Score bands for the three pedestrian tolerance subgroups.
Characteristic grouping
In this study, the features were divided into different groups to identify the combination of key features with the lowest dimensionality while ensuring accuracy. This approach, rather than simply inputting all features, reduces the workload of data collection and processing. First, according to the meaning of each feature, gender, age, distraction state, and walking speed were summarized as the pedestrians’ own features; therefore, \({i}_{1}\) , \({i}_{2}\) , \({i}_{3}\) , and \({i}_{8}\) were added to the subset of the pedestrians’ own features as M1. On the other hand, the presence of violators in front of the pedestrian, the time attribute, the pedestrian volume, and the size of the group were summarized as the characteristics of the environment, so \({i}_{4}\) , \({i}_{5}\) , \({i}_{6}\) , and \({i}_{7}\) were added to the set of environmental features as M2. The feature set was denoted as M2. In addition, the feature set was selected as M3 according to the result of the significance of the RF model alone. The feature set that was significant to the model result was selected as M4 by combining the three models of RF, SVR, and XGB. The results are shown in Table 5 .
Evaluation indicators
Because this study aimed to predict the pedestrian red light tolerance time, only numerical regression predictions were obtained. Therefore, the MSE (as shown in Eq. 12 ), mean absolute error (MAE), and mean absolute percentage error (MAPE) were used as the model judging indexes. The smaller the values of MSE, MAE, and MAPE, the smaller the difference between the predicted value and the real value of the model, and the better the performance of the model. The formulae for calculating MAE and MAPE are as follows:
Analysis of the predicted pedestrian crossing red light tolerance time results
Low tolerance group analysis.
These pedestrians had small values of tolerance time, and thus, the MAPE was sensitive to errors. The results of the model using the four different feature combinations are presented in Table 6 and Fig. 10 . From Table 6 , it can be observed that the best input is M4, at which point the model MSE and MAE are 6.58 and 1.91, respectively, and the MAPE is 19.78%. This indicates that the prediction error of the model for the pedestrian red light tolerance time for the low tolerance group was within 2 s on average, whereas the overall error was less than 20%. Overall, the prediction results of the model for the low tolerance group exhibited small errors in their absolute values, which can truly reflect the specific tolerance situation of the pedestrians. The error percentage, although affected by the characteristics of the data itself, was still within the acceptable range.

a Predicted values for the low tolerance M1 feature group. b Predicted values for the low tolerance M2feature group. c Predicted values for the low tolerance M3 feature group. d Predicted values for the low tolerance M4 feature group.
Medium tolerance group analysis
The results obtained using four different combinations of features in the medium tolerance grouping are shown in Table 7 as well as and Fig. 11 . From the table, it can be observed that the best input was that of the M4 group, and the M3 group had similar results. The MSE and MAE of the best input model were both 4.82 and 1.53, respectively, whereas the MAPE of the model was 7.63%. This indicates that the model was more accurate, with less error in the mean values for the medium tolerance group, which is in line with the case of the low tolerance group. At the same time, there was a significant decrease in the MAPE of the model, which also indicates that the MAPE in the low tolerance group was affected more by the size of the value itself. Except for that of the M2 input, the average error value of the model in predicting the pedestrian red light tolerance time was less than 10%, indicating that the integrated model also has good accuracy in predicting the pedestrian red light tolerance time in the medium tolerance group.

a Predicted values for the medium tolerance M1 feature group. b Predicted values for the medium tolerance M2 feature group. c Predicted values for the medium tolerance M3 feature group. d Predicted values for the medium tolerance M4 feature group.
High tolerance group analysis
The results obtained using the four different feature combinations in the high tolerance group are presented in Table 8 and Fig. 12 . Combining the graphs shows that the prediction results for the M4 group are still optimal. At this point, the MSE and MAE of the model were 33.32 and 3.89, respectively, and the MAPE was 10.14%. Although the MSE and MAE increased, the MAPE was 10.14%, which was not significantly higher than that of the medium tolerance group. The accuracy of the model continued to be consistent, with a significant increase in the magnitude of the values.

a Predicted values for the high tolerance M1 feature group. b Predicted values for the high tolerance M2 feature group. c Predicted values for the high tolerance M3 feature group. d Predicted values for the high tolerance M4 feature group.
Model comparison
To further verify the effectiveness of the text model, separate XGB, RF, MLP, and SVR models were established for comparative analysis of the test set. Table 9 shows the model evaluation indices according to the index data. It can be seen that the prediction error indices of the stacking model with tolerance grouping were the best among the multiple models. The MSE of the stacking model without tolerance grouping was 34.98, and the MAE was 3.97, whereas the MSEs of the single MLP, XGB, RF, and SVR models were 39.86, 37.29, 41.74, and 67.23, respectively, and the MAEs were 4.90, 4.12, 5.00, and 7.19, respectively; the overall prediction accuracies were weaker than those of the stacking model with grouping. Using the M4 feature group, the predicted values of each primary model were inputted into the secondary-layer model as feature variables. The feature importance scores obtained using the MLR model are listed in Table 10 . Based on the results, it can be concluded that the performance of the same model varies across different groups.
Discussion on the practical application of the model
The global population structure is currently undergoing significant changes, which have the potential to have a profound impact on global demographics. In China, for instance, the proportion of young adults is on the decline, while the proportion of older individuals is on the rise. Firstly, the proportion of elderly people who walk is higher than that of young adults. Secondly, the time perception and tolerance of elderly people, children and young adults are different. Concurrently, contemporary computer technology furnishes the requisite conditions for the exact formulation of signal timing strategies for pedestrian crossings. As evidenced by the instantiation results presented in Section 3, the proposed model’s accuracy is sufficient to estimate pedestrian crossing tolerance times under signal control conditions. The practical application of the model can be discussed in terms of active adaptation as well as passive response to traffic control measures.
It is capable of meeting the active adaptation needs of crossing signal timing. For each individual arriving at the crossing waiting area at each time point, the degree of tolerance can be calculated. This allows the decision-maker to obtain the probability distribution function, expectation value, variance, and other statistical parameters of the tolerance time of the waiting crowd at each moment. Furthermore, a certain level of significance (e.g., 5%) is employed to calculate the upper limit of the current overall crowd’s waiting time, which serves as the foundation for determining the current signal’s maximum red-light duration. In a vehicle networking environment, roadside networked facilities can provide real-time feedback to networked vehicles regarding the time distribution of pedestrians waiting to cross the street. This allows for advance warning to networked vehicles to adjust their speed accordingly. The configuration of the red light duration can address the current issue of fixed parameters, which are challenging to adapt to the composition of pedestrians at different times. It can flexibly adapt to the composition of the crowd in real time, thus reducing the probability of illegal pedestrian crossings and coordinating the efficiency of pedestrian and motor vehicle traffic.
It is capable of meeting the passive response requirements of traffic management in specific instances. The computer is able to calculate the tolerance time of each individual at the crossing waiting area, and subsequently issue a warning to the relevant traffic management personnel. In particular, when the volume of motor vehicle traffic is considerable and other factors are insufficient to enable pedestrians to traverse the crossing within the maximum tolerable time, traffic management personnel can direct their attention towards those pedestrians exhibiting a low tolerance level. Extending the length of the tolerance time for those pedestrians in the form of external intervention reduces the probability of pedestrian crossing violations.
This study proposes a stacking model using random forest, XGBoost, support vector machine regression, and multi-layer perceptron models combined with Bayesian hyperparameter optimization in the initial-layer, and multiple linear regression in the secondary-layer to predict pedestrian red light tolerance time under signal control conditions. The model used measured video data of pedestrians crossing, and based on the pedestrian tolerance risk score output by the random survival forest model, K-means clustering was performed to divide the pedestrian dataset into three types of low, medium, and high tolerance. At the same time, different types of input feature groups were divided from multiple perspectives. The M4 input group, which was voted for by multiple machine learning models, performed the best among the three tolerance type groupings, with MSE, MAE, and MAPE of 6.58, 1.91, and 19.78%, respectively, in the low tolerance type group; MSE, MAE, and MAPE of 4.82, 1.53, and 7.63%, respectively, in the medium tolerance type group; and MSE, MAE, and MAPE of 33.32, 3.89, and 10.14%, respectively, in the high tolerance type group. Furthermore, separate XGB, RF, MLP, SVR, and ungrouped stacking models were established to compare and analyze the grouped stacking model in this study. The results revealed that the proposed model performed optimally. In general, a stacking model with tolerance grouping integrates the advantages of machine learning and deep learning and can effectively predict the individual red light tolerance time of pedestrians under signal control by means of feature selection and hyperparameter optimization strategies. Compared to the existing methods, which focus on the cycle of large time granularity and it is difficult to reflect the individual characteristics of the tolerance time for pedestrian groups, this model can dynamically calculate the tolerance time of individual pedestrians over time. The results can be used to calculate the probability distribution and key parameters of tolerance time for different compositions of people at each moment, which can be used as a basis for flexible timing of pedestrian crossing signals. At the same time, the calculation results of each pedestrian’s tolerance time can remind traffic managers to pay attention to and, if necessary, actively intervene to reduce the probability of illegal pedestrian crossing. The model provides a necessary tool for building a pedestrian-friendly city and coordinating the benefits of pedestrian and vehicular traffic.
There are some shortcomings in this study, which can be improved in the following aspects. Some of the models in this study use machine learning and deep learning models, which are susceptible to data influence. As a result, there is a risk that they may perform well on the specific dataset used in this study but poorly on other datasets. Future research could consider adding observable feature values, such as travel time, temperature, weather, and built-up area environment, to increase the ability of the model to adapt to a variety of refined conditions.
Data availability
The datasets generated during and analyzed during the current study are available from the corresponding author on reasonable request.
Ghadirzadeh S, Mirbaha B, Rassafi AA (2020) Analysing pedestrian–vehicle conflict behaviours at urban pedestrian crossings. J Proc Inst Civ Eng Munic Eng 175(2):107–118. https://doi.org/10.1680/jmuen.21.00016
Article Google Scholar
World Health Organization (2023) Global Status Report on Road Safety. WHO, Geneva
Google Scholar
Kumar A, Ghosh I (2022) Non-compliance behaviour of pedestrians and the associated conflicts at signalized intersections in India. J Saf Sci 147:105604. https://doi.org/10.1016/j.ssci.2021.105604
Shaaban K, Abdelwarith K (2020) Pedestrian attribute analysis using agent-based modeling. J Appl Sci. https://api.semanticscholar.org/CorpusID:225624019
Truong LT, Thai NH, Le TV, Debnath AK (2022) Pedestrian distraction: Mobile phone use and its associations with other risky crossing behaviours and conflict situations. J Saf Sci 153:105816. https://doi.org/10.1016/j.ssci.2022.105816
Cui Z, Zhuang X, Chen W, Ma G (2022) Feedback frequency of graphical countdown timers affects pedestrian estimated waiting time at red lights. J Transp Res Part F: Traffic Psychol Behav 88:184–196
Chen Q, Ye S, Chen L (2023) Pedestrian crossing decisions during pedestrian transition signals at signalized intersections. J Transp Res Rec 2677(2):1520–1540
Asaba M, Saito T (1998) A study on pedestrian signal phase indication system. Proc Ninth Int Confe Road Transp Inf Control (Conf. Publ. No. 454). IET
Zhang Z, Wang D, Liu T, Liu Y (2016) Waiting endurance time of pedestrians crossing at signalized intersections in Beijing. J Transp Res Rec 2581(1):95–103
Jain A, Gupta A, Rastogi R (2014) Pedestrian crossing behaviour analysis at intersections. J Int J Traffic Transp Eng 4(1):103–116
Tian K, Markkula G, Wei C, Lee YM, Madigan R, Merat N, Romano R (2022) Explaining unsafe pedestrian road crossing behaviours using a Psychophysics-based gap acceptance model. J Saf Sci 154:105837
Hamed MM (2001) Analysis of pedestrians’ behavior at pedestrian crossings. J Saf Sci 38(1):63–82
Tiwari G, Bangdiwala S et al. (2007) Survival Analysis: Pedestrian risk exposure at signalized intersections. J Transp Res Part F: Traffic Psychol Behav 10:77–89
Dhoke A, Kumar A, Ghosh I (2021) Hazard-based duration approach to pedestrian crossing behavior at signalized intersections. J Transp Res Rec 2675(9):519–532
Liu Y, Alsaleh R, Sayed T (2022) Modeling pedestrian temporal violations at signalized crosswalks: A random intercept parametric survival model. J Transp Res Rec 2676(6):707–720
Russo BJ, James E, Aguilar CY, Smaglik EJ (2018) Pedestrian behavior at signalized intersection crosswalks: observational study of factors associated with distracted walking, pedestrian violations, and walking speed. J Transp Res Rec 2672:1–12
Zhu D, Sze NN, Bai L (2021) Roles of personal and environmental factors in the red light running propensity of pedestrian: Case study at the urban crosswalks. J Transp Res Part F: Traffic Psychol Behav 76:47–58
Zhuang X, Wu C, Ma S (2018) Cross or wait? pedestrian decision making during clearance phase at signalized intersections. J Accid Anal Prev 111:115–124
Article ADS Google Scholar
Kalatian A, Farooq B (2019) Deepwait: Pedestrian wait time estimation in mixed traffic conditions using deep survival analysis. In: 2019 IEEE Intell Transp Syst Conf (ITSC) (pp. 2034-2039). IEEE Press
Download references
Acknowledgements
Thank the Chongqing Transportation Science and Technology Project (No. CQJT-CZKJ2023-10); the Sichuan Science and Technology Program (No. 2022YFG0132); the Chongqing Social Science Planning Project (No.2021NDYB035); the Chongqing Postgraduate Joint Training Base Project (No. JDLHPYJD2019007).
Author information
Authors and affiliations.
Chongqing Key Laboratory of Intelligent Integrated and Multidimensional Transportation System, Chongqing Jiaotong University, Chongqing, PR China
Xinghua Hu & Jiahao Zhao
School of Traffic &Transportation, Chongqing Jiaotong University, Chongqing, PR China
Nanhao Wang
Chongqing Youliang Science & Technology Co., Ltd., Chongqing, PR China
Xiaochuan Zhou
Chongqing Transport Planning Institute, Chongqing, PR China
You can also search for this author in PubMed Google Scholar
Contributions
Conceptualization and writing—original draft preparation: XH and NW; investigation and data analysis: XZ and BL; methodology and software: XH, NW and JZ; validation and formal analysis: XH and JZ; writing—review and editing: XH, XZ and BL. All authors have read and agree to the published version of the paper.
Corresponding author
Correspondence to Xinghua Hu .
Ethics declarations
Competing interests.
The authors declare no competing interests.
Ethical approval
All procedures used in this study adhere to the tenets of the Declaration of Helsinki. Ethical approval was requested by the corresponding author in July 2023 and granted by Ethics Committee of Chongqing Jiaotong University in August 2023 (Approval number: 2023081501).
Informed consent
In order to avoid the bias of prior informed consent on the outcome of crossing the street waiting behavior, this data acquisition was done by informing the respondents immediately after the survey i.e. post hoc consent. Participants were informed about the aim and scope of the study, the ways the data would be used, and the potential to withdraw from the study at any point. Informed consent was obtained for all data used in the study. The informed consent method was requested by the corresponding author in July 2023 and granted by Ethics Committee of Chongqing Jiaotong University in August 2023 (Approval number: 2023081501).
Additional information
Publisher’s note Springer Nature remains neutral with regard to jurisdictional claims in published maps and institutional affiliations.
Supplementary information
Supplementary materials, rights and permissions.
Open Access This article is licensed under a Creative Commons Attribution-NonCommercial-NoDerivatives 4.0 International License, which permits any non-commercial use, sharing, distribution and reproduction in any medium or format, as long as you give appropriate credit to the original author(s) and the source, provide a link to the Creative Commons licence, and indicate if you modified the licensed material. You do not have permission under this licence to share adapted material derived from this article or parts of it. The images or other third party material in this article are included in the article’s Creative Commons licence, unless indicated otherwise in a credit line to the material. If material is not included in the article’s Creative Commons licence and your intended use is not permitted by statutory regulation or exceeds the permitted use, you will need to obtain permission directly from the copyright holder. To view a copy of this licence, visit http://creativecommons.org/licenses/by-nc-nd/4.0/ .
Reprints and permissions
About this article
Cite this article.
Hu, X., Wang, N., Zhao, J. et al. A measurement model of pedestrian tolerance time under signal-controlled conditions. Humanit Soc Sci Commun 11 , 1116 (2024). https://doi.org/10.1057/s41599-024-03625-x
Download citation
Received : 02 April 2024
Accepted : 19 August 2024
Published : 31 August 2024
DOI : https://doi.org/10.1057/s41599-024-03625-x
Share this article
Anyone you share the following link with will be able to read this content:
Sorry, a shareable link is not currently available for this article.
Provided by the Springer Nature SharedIt content-sharing initiative
Quick links
- Explore articles by subject
- Guide to authors
- Editorial policies

IMAGES
VIDEO
COMMENTS
Learn what secondary research is, how to use it, and what types and examples of secondary sources exist. Scribbr is a proofreading service that helps you improve your academic writing.
What is secondary research? Secondary research, also known as desk research, is a research method that involves compiling existing data sourced from a variety of channels. This includes internal sources (e.g.in-house research) or, more commonly, external sources (such as government statistics, organizational bodies, and the internet).
The data analysis method comprises of content analysis for dataset categorization and thematic discourse analysis to answer the pre-set research questions. Additionally, the methodology covers the ethical and legal considerations relating to secondary online data and reporting the research findings of such data.
Secondary research is a method that involves using already existing data. Learn about it with examples, advantages and disadvantages.
Discover the essentials of secondary research, including its definition, methods, sources, and examples. Learn how to effectively conduct secondary research, understand its advantages and disadvantages, and compare it with primary research to make informed decisions for your projects.
What is Secondary Research? Secondary Research refers to the process of gathering and analyzing existing data, information, and knowledge that has been previously collected and compiled by others. This approach allows researchers to leverage available sources, such as articles, reports, and databases, to gain insights, validate hypotheses, and make informed decisions without collecting new data.
Learn what secondary research is, how to conduct it, and why it is useful for systematic investigation. Find out the common sources and methods of secondary research, such as online data, archives, libraries, and institutions.
Learn what secondary research is, how it differs from primary research, and how to conduct it. Find out the advantages of using existing data, the types of sources, and the steps to follow.
What is secondary research? Learn more about primary vs. secondary research, the definition of secondary research, methods, types, and examples.
Secondary research, also known as desk research, is a research method that involves the use of information previously collected for another research purpose. In this chapter, we are going to explain what secondary research is, how it works, and share some examples of it in practice.
Secondary research involves the summary, collation and/or synthesis of existing research. Secondary research is contrasted with primary research in that primary research involves the generation of data, whereas secondary research uses primary research sources as a source of data for analysis. [ 1] A notable marker of primary research is the inclusion of a "methods" section, where the authors ...
Learn how to conduct efficient and effective secondary research for your dissertation with our comprehensive step-by-step guide. Master research skills, identify credible sources, employ advanced search strategies, and integrate secondary data with primary research for a robust dissertation.
Secondary data analysis research may be limited to descriptive, exploratory, and correlational designs and nonparametric statistical tests. By their nature, SDA studies are observational and retrospective, and the investigator cannot examine causal relationships (by a randomized, controlled design).
Secondary research uses research and data that has already been carried out. It is sometimes referred to as desk research. It is a good starting point for any type of research as it enables you to analyse what research has already been undertaken and identify any gaps. You may only need to carry out secondary research for your assessment or you ...
Secondary research is also essential if your main goal is primary research. Research funding is obtained only by using secondary research to show the need for the primary research you want to conduct. In fact, primary research depends on secondary research to prove that it is indeed new and original research and not just a rehash or replication of somebody else's work.
Whether you're a student conducting a research project or a professional seeking insights for decision-making, understanding secondary research is essential. This comprehensive guide will take you through the ins and outs of secondary research, its types, steps, advantages, disadvantages, and applications in different fields.
Secondary research is the analysis of pre-existing data and resources gathered by others, offering valuable insights without conducting new research.
Compared to primary research, the collection of secondary data can be faster and cheaper to obtain, depending on the sources you use. Secondary data can come from internal or external sources. Internal sources of secondary data include ready-to-use data or data that requires further processing available in internal management support systems ...
This article goes into what secondary research is, its methods, the difference between primary and secondary research & more.
See what secondary research is, explore its key methods, discover how it can help you find solutions to workplace problems and learn to conduct desk research.
Secondary research methodology offers valuable information that can significantly impact your decision-making. The benefits of this methodology are numerous, from cost-effectiveness and time-saving to wider data sources.
Secondary research is the analysis, summary or synthesis of already existing published research. Instead of collecting original data, as in primary research, secondary research involves data or the results of data analyses already collected.
Primary research definition. When you conduct primary research, you're collecting data by doing your own surveys or observations. Secondary research definition: In secondary research, you're looking at existing data from other researchers, such as academic journals, government agencies or national statistics. Free Ebook: The Qualtrics ...
Although mixed methods research may inform transition planning, practice, and services, little is known about the application of mixed methods research in the field of secondary transition. This systematic literature review examined the application of mixed methods approaches across 39 peer-reviewed articles focused on secondary transition ...
Practices for improving secondary school climate: A systematic review of the research literature. American Journal of Community Psychology, 58(1-2), 174-191. https:// ... It defines school climate and provides a methodology for identifying and evaluating relevant studies. The review identified 66 studies with varying strength of evidence and ...
In this lesson plan, students will learn how to distinguish between primary and secondary sources and how to use them for historical research. The central type of primary sources used in this lesson plan are fugitive slave advertisements: short, concise, detailed, and engaging primary sources that convey the history of slavery and freedom seeking in striking terms.
Unlike secondary research, it provides customized insights for your business needs. This article explains primary market research, its methods, and its benefits and drawbacks. Key Takeaways. Primary market research involves direct data collection from target audiences, offering tailored insights that enhance understanding of consumer behaviors ...
The object of study of systematic reviews is primary research, which is why this type of research is known as secondary research (Ferreira et al., 2011). ... student would need to develop their abilities to the maximum, using various methodologies, such as applied behaviour analysis, problem- and resource-based learning, social stories or ...
Relevance. The relevance of this research lies in the indispensable role of laboratory work in physics education. Laboratory sessions facilitate the integration of knowledge, research, and practical skills, fostering essential qualities such as independence, analytical thinking, and the application of theoretical concepts to real-world situations. As comprehensive schools evolve, there is a ...
The tolerance of pedestrians to red light signals is a crucial factor in urban residents' travel experiences and road traffic safety. To address the current lack of research on methods for ...