By using this site you agree to our use of cookies. Please refer to our privacy policy for more information. Close

7 Powerful Problem-Solving Root Cause Analysis Tools
The first step to solving a problem is to define the problem precisely. It is the heart of problem-solving.
Root cause analysis is the second important element of problem-solving in quality management. The reason is if you don't know what the problem is, you can never solve the exact problem that is hurting the quality.

Manufacturers have a variety of problem-solving tools at hand. However, they need to know when to use which tool in a manner that is appropriate for the situation. In this article, we discuss 7 tools including:
- The Ishikawa Fishbone Diagram (IFD)
- Pareto Chart
- Failure Mode and Effects Analysis (FMEA)
- Scatter Diagram
- Affinity Diagram
- Fault Tree Analysis (FTA)
1. The Ishikawa Fishbone Diagram IFD

The model introduced by Ishikawa (also known as the fishbone diagram) is considered one of the most robust methods for conducting root cause analysis. This model uses the assessment of the 6Ms as a methodology for identifying the true or most probable root cause to determine corrective and preventive actions. The 6Ms include:
- Measurement,
- Mother Nature- i.e., Environment
Related Training: Fishbone Diagramming
2. Pareto Chart

The Pareto Chart is a series of bars whose heights reflect the frequency or impact of problems. On the Chart, bars are arranged in descending order of height from left to right, which means the categories represented by the tall bars on the left are relatively more frequent than those on the right.
Related Training: EFFECTIVE INVESTIGATIONS AND CORRECTIVE ACTIONS (CAPA) Establishing and resolving the root causes of deviations, problems and failures
This model uses the 5 Why by asking why 5 times to find the root cause of the problem. It generally takes five iterations of the questioning process to arrive at the root cause of the problem and that's why this model got its name as 5 Whys. But it is perfectly fine for a facilitator to ask less or more questions depending on the needs.

Related training: Accident/Incident Investigation and Root Cause Analysis
4. Failure Mode and Effects Analysis (FMEA)
| Process | Failure | Effect | S | Causes | O | D | RPN |
|---|---|---|---|---|---|---|---|
FMEA is a technique used to identify process and product problems before they occur. It focuses on how and when a system will fail, not if it will fail. In this model, each failure mode is assessed for:
- Severity (S)
- Occurrence (O)
- Detection (D)
A combination of the three scores produces a risk priority number (RPN). The RPN is then provided a ranking system to prioritize which problem must gain more attention first.
Related Training: Failure Mode Effects Analysis
5. Scatter Diagram

A scatter diagram also known as a scatter plot is a graph in which the values of two variables are plotted along two axes, the pattern of the resulting points revealing any correlation present.
To use scatter plots in root cause analysis, an independent variable or suspected cause is plotted on the x-axis and the dependent variable (the effect) is plotted on the y-axis. If the pattern reflects a clear curve or line, it means they are correlated. If required, more sophisticated correlation analyses can be continued.
Related Training: Excel Charting Basics - Produce Professional-Looking Excel Charts
6. Affinity Diagram
Also known as KJ Diagram, this model is used to represent the structure of big and complex factors that impact a problem or a situation. It divides these factors into small classifications according to their similarity to assist in identifying the major causes of the problem.

7. Fault Tree Analysis (FTA)
The Fault Tree Analysis uses Boolean logic to arrive at the cause of a problem. It begins with a defined problem and works backward to identify what factors contributed to the problem using a graphical representation called the Fault Tree. It takes a top-down approach starting with the problem and evaluating the factors that caused the problem.

Finding the root cause isn't an easy because there is not always one root cause. You may have to repeat your experiment several times to arrive at it to eliminate the encountered problem. Using a scientific approach to solving problem works. So, its important to learn the several problem-solving tools and techniques at your fingertips so you can use the ones appropriate for different situations.
ComplianceOnline Trainings on Root Cause Analysis
P&PC, SPC/6Sigma, Failure Investigation, Root Cause Analysis, PDCA, DMAIC, A3 This webinar will define what are the US FDA's expectation for Production and Process Control / Product Realization, the use of statistical tehniques, 6 sigma, SPC, for establishing, controlling , and verifying the acceptability of process capability and product characteristics, product acceptance or validation and other studies. Non-conformance, OOS, deviations Failure Investigations, and Root Cause Analysis, PDCA, DMAIC, and similar project drivers to improvement, A# and similar dash boards.
Accident/Incident Investigation and Root Cause Analysis If a major workplace injury or illness occurred, what would you do? How would you properly investigate it? What could be done to prevent it from happening again? A properly executed accident/incident investigation drives to the root causes of the workplace accident to prevent a repeat occurrence. A good accident/incident investigation process includes identifying the investigation team, establishing/reviewing written procedures, identifying root causes and tracking of all safety hazards found to completion.
Root Cause Analysis - The Heart of Corrective Action This presentation will explain the importance of root cause analysis and how it fits into an effective corrective and preventive action system. It will cover where else in your quality management system root cause analysis can be used and will give examples of some of the techniques for doing an effective root cause analysis. Attendees will learn how root cause analysis can be used in process control.
Addressing Non-Conformances using Root Cause Analysis (RCA) RCA assumes that systems and events are interrelated. An action in one area triggers an action in another, and another, and so on. By tracing back these actions, you can discover where the issue started and how it grew into the problem you're now facing.
Risk Management Under ISO 14971 ISO 14971:2019 is the definitive standard for risk management for medical devices and IVDs. The standard lays out a comprehensive approach to managing risks in the life sciences. The course will discuss practical approaches to complying with the standard.
Introduction to Root Cause Investigation for CAPA If you have reoccurring problems showing up in your quality systems, your CAPA system is not effective and you have not performed an in-depth root cause analysis to be able to detect through proper problem solving tools and quality data sources, the true root cause of your problem. Unless you can get to the true root cause of a failure, nonconformity, defect or other undesirable situation, your CAPA system will not be successful.
Root Cause Analysis and CAPA Controls for a Compliant Quality System In this CAPA webinar, learn various regulations governing Corrective and Preventive Actions (CAPA) and how organization should collect information, analyze information, identify, investigate product and quality problems, and take appropriate and effective corrective and/or preventive action to prevent their recurrence.
How to Design and Implement a Dynamic Control Plan This webinar training will discuss how to design a dynamic control plan that combines FMEA and the control plan by extending the FMEA to encompass the elements of the control plan and create a living document that helps to drive continual improvement.
An Easy to Implement Integrated Risk Management Approach Compliant with ISO 14971 This integrated risk management training for medical devices will discuss how to incorporate risk management as per ISO 14971 guidelines in all phases of medical device development. It will highlight the documentation needed to support the decisions made as part of the risk management process.
The Use and Mis-use of FMEA in Medical Device Risk Management The presentation will discuss the proper use of FMEA in risk management and how to recognize and avoid the traps associated with this tool in order to have a more efficient risk management process. Most medical device manufacturers use FMEA as a part of their risk management system. Most medical device manufacturers use FMEA as a part of their risk management system.
Root Cause Analysis for CAPA Management (Shutting Down the Alligator Farm) Emphasis will be placed on realizing system interactions and cultural environment that often lies at the root of the problem and prevents true root cause analysis. This webinar will benefit any organization that wants to improve the effectiveness of their CAPA and failure investigation processes.
Root Cause Analysis for Corrective and Preventive Action (CAPA) The Quality Systems Regulation (21 CFR 820) and the Quality Management Standard for Medical Devices (ISO 13485:2003), require medical device companies to establish and maintain procedures for implementing corrective and preventive action (CAPA) as an integral part of the quality system.
Strategies for an Effective Root Cause Analysis and CAPA Program This webinar will provide valuable assistance to all regulated companies, a CAPA program is a requirement across the Medical Device, Diagnostic, Pharmaceutical, and Biologics fields. This session will discuss the importance, requirements, and elements of a root cause-based CAPA program, as well as detailing the most effective ways to determine root cause and describing the uses of CAPA data.
Legal Disclaimer
This piece of content and any of its enclosures, attachments or appendices, references are created to provide solely for information purpose. ComplianceOnline has made all effort to provide accurate information concerning the subject matter covered. This content is created from interpretation, and understanding of relevant and applicable information and it is not all inclusive. It can be best used in conjunction with your professional judgment and discretion.
However, this piece of content and any other ancillary items disseminated in connection with same are not necessarily prepared by a person licensed to practice law in a particular jurisdiction. This piece of content is not a substitute for the advice of an attorney. If you require legal or other expert advice, you should seek the services of a competent attorney or other professional.
ComplianceOnline necessarily is not, cannot and will not be liable for any claims, damages, or regulatory legal proceedings initiated as a consequence of you using whole or any part of the content present in this document. If any action, claim for damages, or regulatory proceedings is commenced against ComplianceOnline as a consequence of your use of this document, then and in that event, you agree to indemnify ComplianceOnline for such claims, and for any attorney's fees expended by ComplianceOnline in connection with defense of same.
- RCA 101 – 5-Why Analysis (Free Training)
- RCA201 – Basic Failure Analysis
- RCA 301 – PROACT® RCA Certification
- RCA401 – RCA Train The Trainer
- Other Trainings
- 5 Whys Root Cause Analysis Template
- RCA Template
- Chronic Failure Calculator
7 Powerful Root Cause Analysis Tools and Techniques

By Sebastian Traeger
Updated: April 21, 2024
Reading Time: 5 minutes
1. The Ishikawa Fishbone Diagram (IFD)
2. pareto chart, 4. failure mode and effects analysis (fmea), 5. proact® rca method, 6. affinity diagram, 7. fault tree analysis (fta).
With over two decades in business – spanning strategy consulting, tech startups and executive leadership – I am committed to helping your organization thrive. At Reliability, we’re on a mission to help enhance strategic decision-making and operational excellence through the power of Root Cause Analysis, and I hope this article will be helpful! Our goal is to help you better understand these root cause analysis techniques by offering insights and practical tips based on years of experience. Whether you’re new to doing RCAs or a seasoned pro, we trust this will be useful in your journey towards working hard and working smart.
Root Cause Analysis (RCA) shines as a pivotal process that helps organizations identify the underlying reasons for problems, failures, and inefficiencies. The goal is simple: find the cause, fix it, and prevent it from happening again. But the process can be complex, and that’s where various RCA techniques come into play.
Let’s dive into seven widely utilized RCA techniques and explore how they can empower your team’s problem-solving efforts.
Named after Japanese quality control statistician Kaoru Ishikawa, the Fishbone Diagram is a visual tool designed for group discussions. It helps teams track back to the potential root causes of a problem by sorting and relating them in a structured way. The diagram resembles a fishbone, with the problem at the head and the causes branching off the spine like bones. This visualization aids in categorizing potential causes and studying their complex interrelationships.

The Pareto Chart, rooted in the Pareto Principle, is a visual tool that helps teams identify the most significant factors in a set of data. In most situations, 80% of problems can be traced back to about 20% of causes. By arranging bar heights from tallest to shortest, teams can prioritize the most significant factors and focus their improvement efforts where they can have the most impact.

The 5 Whys method is the epitome of simplicity in getting to the bottom of a problem. By repeatedly asking ‘why’ (typically five times), you can delve beneath the surface-level symptoms of a problem to unearth the root cause. This iterative interrogation is most effective when answers are grounded in factual evidence.

When prevention is better than cure, Failure Mode and Effects Analysis (FMEA) steps in. This systematic, proactive method helps teams identify where and how a process might fail. By predicting and examining potential process breakdowns and their impacts, teams can rectify issues before they turn into failures. FMEA is a three-step process that involves identifying potential failures, analyzing their effects, and prioritizing them based on severity, occurrence, and detection ratings.

The PROACT ® RCA technique is a robust process designed to drive significant business results. Notably used to identify and analyze ‘chronic failures,’ which can otherwise be overlooked, this method is defined by its name:
PReserving Evidence and Acquiring Data: Initial evidence collection step based on the 5-P’s – Parts, Position, People, Paper, and Paradigms.
Order Your Analysis Team and Assign Resources: Assembling an unbiased team to analyze a specific failure.
Analyze the Event: Reconstructing the event using a logic tree to identify Physical, Human, and Latent Root Causes.
Communicate Findings and Recommendations: Developing and implementing solutions to prevent root cause recurrence.
Track and Measure Impact for Bottom Line Results: Tracking the success of implemented recommendations and correlating the RCA’s effectiveness with ROI.
PROACT® RCA excels in mitigating risk, optimizing cost, and boosting performance, making it a valuable addition to any RCA toolkit.

The Affinity Diagram is a powerful tool for dealing with large amounts of data. It organizes a broad range of information into groups based on their natural relationships, creating a clear, visual representation of complex situations. It’s particularly beneficial for condensing feedback from brainstorming sessions into manageable categories, fostering a better understanding of the broader picture.

Fault Tree Analysis (FTA) is a top-down, deductive failure analysis that explores the causes of faults or problems. It involves graphically mapping multiple causal chains to track back to possible root causes, using a tree-like diagram. FTA is particularly useful in high-risk industries, such as aerospace and nuclear power, where preventing failure is crucial.

Each RCA technique provides a unique approach for viewing and understanding problems, helping you pinpoint the root cause more effectively. The key is to understand when and how to use each tool, which can significantly enhance your team’s problem-solving capabilities.
Power up your RCA analysis with our EasyRCA and revolutionize your problem-solving process. Start Your Free Trial.
| Ishikawa Fishbone Diagram | Visual representation of complex relationships | When there are many possible causes to a problem |
| Pareto Chart | Prioritizes problem areas based on impact | When trying to identify the most significant causes |
| 5 Whys | Simple, iterative problem-solving technique | When the problem is straightforward and the solution is not immediately apparent |
| FMEA | Proactive, preventative approach | When addressing complex processes that could lead to serious consequences if failed |
| PROACT® RCA Method | Comprehensive, result-driven approach | When dealing with chronic, recurrent failures |
| Affinity Diagram | Groups large data into manageable categories | When trying to find patterns and connections in large amounts of data |
| Fault Tree Analysis (FTA) | Visual mapping of causal chains | When working in high-risk industries where prevention is crucial |
In conclusion, the techniques presented offer a diverse set of tools to help organizations address problems and inefficiencies effectively. From visual representations like the Ishikawa Fishbone Diagram and Pareto Chart to more proactive approaches such as the 5 Whys and Failure Mode and Effects Analysis (FMEA), each technique provides a unique perspective on identifying and mitigating root causes.
The PROACT® RCA Method stands out for its comprehensive process, particularly suited for chronic failures. Additionally, the Affinity Diagram and Fault Tree Analysis (FTA) contribute valuable insights by organizing data and exploring causal chains, respectively. Leveraging these techniques strategically enhances a team’s problem-solving capabilities, enabling them to make informed decisions and drive continuous improvement.
I hope you found these 7 techniques insightful and actionable! Stay tuned for more thought-provoking articles as we continue to share our knowledge. Success is rooted in a thorough understanding and consistent application, and we hope this article was a step in unlocking the full potential of Root Cause Analysis for your organization. Reliability runs initiatives such as an online learning center focused on the proprietary PROACT® RCA methodology and EasyRCA.com software. For additional resources, visit our Reliability Resources .
- Root Cause Analysis /
Recent Posts
How to Perform Root Cause Investigations?
Post-Incident Analysis for Enhanced Reliability
How To Conduct Incident Analysis?
The Role of Artificial Intelligence in Reliability Engineering
Root Cause Analysis Software
Our RCA software mobilizes your team to complete standardized RCA’s while giving you the enterprise-wide data you need to increase asset performance and keep your team safe.
Root Cause Analysis Training
[email protected]
Tel: 1 (800) 457-0645
Share article with friends:
- Skip to main content
- Skip to primary sidebar
- Skip to footer
Additional menu
Nine essential problem solving tools: The ultimate guide to finding a solution
October 26, 2023 by MindManager Blog
Problem solving may unfold differently depending on the industry, or even the department you work in. However, most agree that before you can fix any issue, you need to be clear on what it is, why it’s happening, and what your ideal long-term solution will achieve.
Understanding both the nature and the cause of a problem is the only way to figure out which actions will help you resolve it.
Given that most problem-solving processes are part inspiration and part perspiration, you’ll be more successful if you can reach for a problem solving tool that facilitates collaboration, encourages creative thinking, and makes it easier to implement the fix you devise.
The problem solving tools include three unique categories: problem solving diagrams, problem solving mind maps, and problem solving software solutions.
They include:
- Fishbone diagrams
- Strategy maps
- Mental maps
- Concept maps
- Layered process audit software
- Charting software
- MindManager
In this article, we’ve put together a roundup of versatile problem solving tools and software to help you and your team map out and repair workplace issues as efficiently as possible.
Let’s get started!
Problem solving diagrams
Mapping your way out of a problem is the simplest way to see where you are, and where you need to end up.
Not only do visual problem maps let you plot the most efficient route from Point A (dysfunctional situation) to Point B (flawless process), problem mapping diagrams make it easier to see:
- The root cause of a dilemma.
- The steps, resources, and personnel associated with each possible solution.
- The least time-consuming, most cost-effective options.
A visual problem solving process help to solidify understanding. Furthermore, it’s a great way for you and your team to transform abstract ideas into a practical, reconstructive plan.
Here are three examples of common problem mapping diagrams you can try with your team:
1. Fishbone diagrams
Fishbone diagrams are a common problem solving tool so-named because, once complete, they resemble the skeleton of a fish.
With the possible root causes of an issue (the ribs) branching off from either side of a spine line attached to the head (the problem), dynamic fishbone diagrams let you:
- Lay out a related set of possible reasons for an existing problem
- Investigate each possibility by breaking it out into sub-causes
- See how contributing factors relate to one another

Fishbone diagrams are also known as cause and effect or Ishikawa diagrams.
2. Flowcharts
A flowchart is an easy-to-understand diagram with a variety of applications. But you can use it to outline and examine how the steps of a flawed process connect.

Made up of a few simple symbols linked with arrows indicating workflow direction, flowcharts clearly illustrate what happens at each stage of a process – and how each event impacts other events and decisions.
3. Strategy maps
Frequently used as a strategic planning tool, strategy maps also work well as problem mapping diagrams. Based on a hierarchal system, thoughts and ideas can be arranged on a single page to flesh out a potential resolution.

Once you’ve got a few tactics you feel are worth exploring as possible ways to overcome a challenge, a strategy map will help you establish the best route to your problem-solving goal.
Problem solving mind maps
Problem solving mind maps are especially valuable in visualization. Because they facilitate the brainstorming process that plays a key role in both root cause analysis and the identification of potential solutions, they help make problems more solvable.
Mind maps are diagrams that represent your thinking. Since many people struggle taking or working with hand-written or typed notes, mind maps were designed to let you lay out and structure your thoughts visually so you can play with ideas, concepts, and solutions the same way your brain does.
By starting with a single notion that branches out into greater detail, problem solving mind maps make it easy to:
- Explain unfamiliar problems or processes in less time
- Share and elaborate on novel ideas
- Achieve better group comprehension that can lead to more effective solutions
Mind maps are a valuable problem solving tool because they’re geared toward bringing out the flexible thinking that creative solutions require. Here are three types of problem solving mind maps you can use to facilitate the brainstorming process.
4. Mental maps
A mental map helps you get your thoughts about what might be causing a workplace issue out of your head and onto a shared digital space.

Because mental maps mirror the way our brains take in and analyze new information, using them to describe your theories visually will help you and your team work through and test those thought models.
5. Idea maps

Idea maps let you take advantage of a wide assortment of colors and images to lay down and organize your scattered thought process. Idea maps are ideal brainstorming tools because they allow you to present and explore ideas about the best way to solve a problem collaboratively, and with a shared sense of enthusiasm for outside-the-box thinking.
6. Concept maps
Concept maps are one of the best ways to shape your thoughts around a potential solution because they let you create interlinked, visual representations of intricate concepts.

By laying out your suggested problem-solving process digitally – and using lines to form and define relationship connections – your group will be able to see how each piece of the solution puzzle connects with another.
Problem solving software solutions
Problem solving software is the best way to take advantage of multiple problem solving tools in one platform. While some software programs are geared toward specific industries or processes – like manufacturing or customer relationship management, for example – others, like MindManager , are purpose-built to work across multiple trades, departments, and teams.
Here are three problem-solving software examples.
7. Layered process audit software
Layered process audits (LPAs) help companies oversee production processes and keep an eye on the cost and quality of the goods they create. Dedicated LPA software makes problem solving easier for manufacturers because it helps them see where costly leaks are occurring and allows all levels of management to get involved in repairing those leaks.
8. Charting software
Charting software comes in all shapes and sizes to fit a variety of business sectors. Pareto charts, for example, combine bar charts with line graphs so companies can compare different problems or contributing factors to determine their frequency, cost, and significance. Charting software is often used in marketing, where a variety of bar charts and X-Y axis diagrams make it possible to display and examine competitor profiles, customer segmentation, and sales trends.
9. MindManager
No matter where you work, or what your problem-solving role looks like, MindManager is a problem solving software that will make your team more productive in figuring out why a process, plan, or project isn’t working the way it should.
Once you know why an obstruction, shortfall, or difficulty exists, you can use MindManager’s wide range of brainstorming and problem mapping diagrams to:
- Find the most promising way to correct the situation
- Activate your chosen solution, and
- Conduct regular checks to make sure your repair work is sustainable
MindManager is the ultimate problem solving software.
Not only is it versatile enough to use as your go-to system for puzzling out all types of workplace problems, MindManager’s built-in forecasting tools, timeline charts, and warning indicators let you plan, implement, and monitor your solutions.
By allowing your group to work together more effectively to break down problems, uncover solutions, and rebuild processes and workflows, MindManager’s versatile collection of problem solving tools will help make everyone on your team a more efficient problem solver.
Download a free trial today to get started!
Ready to take the next step?
MindManager helps boost collaboration and productivity among remote and hybrid teams to achieve better results, faster.
Why choose MindManager?
MindManager® helps individuals, teams, and enterprises bring greater clarity and structure to plans, projects, and processes. It provides visual productivity tools and mind mapping software to help take you and your organization to where you want to be.
Explore MindManager
Filter by Keywords
6 Best Root Cause Analysis Software for Problem-Solving in 2024
Engineering Team
August 22, 2024
Start using ClickUp today
- Manage all your work in one place
- Collaborate with your team
- Use ClickUp for FREE—forever
When solving problems, you either take a proactive approach or a reactive one. Proactive: address the underlying causes of the issue to avoid future challenges. Reactive: respond to issues as they come.
For many project managers, getting at the root cause of an issue before it derails an entire project is key. You’ll save time, money, and valuable resources where they matter most. Plus, you develop insights to build better processes for smoother workflows.
To nail down what’s at the heart of an issue, you need root cause analysis . 👀
In this article, we’ll share ten of the best root cause analysis tools and techniques. We’ll dive into what root cause analysis is and how to choose the right tools for your business.
How to choose the right root cause analysis tool for a specific problem
2. intelex root cause analysis software, 3. apache skywalking, 4. taproot®, 5. appdynamics from cisco, 6. sologic root cause analysis software, root cause analysis software techniques, identify and solve problems with root cause analysis software.
What Is Root Cause Analysis?
Root cause analysis is the process of examining the source of an issue using various techniques and tools. It’s ideal for solving complex problems and helps teams create and prioritize solutions for better quality control and seamless processes.
There are several steps in the process, including:
- Describing the existing issue
- Analyzing metrics and collecting data
- Identifying potential causes
- Brainstorming solutions
- Taking corrective action
- Observing changes and performance

Root cause analysis is a key component of quality management because its goal is to get to the heart of an issue and what’s causing it. That way, you prevent similar problems from arising and causing havoc on a project.
The benefit of root cause analysis is that it allows you to examine potential issues at their core. Plus, it’s designed to assess the issue as well as the solutions as you implement them.
As you gather valuable data on the problems your business faces and the effectiveness of the solutions you try out, you learn how to improve processes every step of the way. The result is a more efficient and successful business that’s able to adapt to whatever comes next. 🤩
You’ll find plenty of tools and methods designed to make root cause analysis easier and streamline the overall process. Luckily, there are also a number of free options in addition to paid analytics tools on the market to gather insights into the cause of the problem.
Of course, not all tools are equally effective. Some are meant to help brainstorm ideas for solutions. Others are designed to dive into metrics to track issues and nail down what’s behind them. And some are complete process software tools designed to integrate into your daily work. 🛠️
Want effective root cause analysis? Here’s what to look for in different tools and techniques:
- Integrations : RCA is best when done collaboratively. Look for tools that let you work with team members to break down problems
- Data tools : You can’t figure out what’s wrong without diving into metrics. Choose a tool that lets you collect data to inform the process
- Specific actions : It’s not enough to know what’s causing a problem. You need a tool that lets you take specific actions, like instantly assigning remedial tasks
6 Best Root Cause Analysis Software Tools in 2024
Ready to figure out what’s at the root of your problem? With these six best root cause analysis tools and techniques, you’ll have what you need to break down an issue. From integrated software tools to free methods, there’s something for everyone. 💪
ClickUp is an all-in-one project management software designed to centralize your work across apps into one collaborative platform. With a rich set of dynamic features to streamline any workflow, teams rely on ClickUp to drive productivity, reduce downtime, and make processes more efficient.
One of the first steps in root cause analysis is to describe the problem. With ClickUp Whiteboards , teams can take a visual approach to this step. With live cursors, actionable tasks, embedding, and more, teams can work collaboratively to identify the root cause and present metrics that support their ideas.
The next step is to collect data. Use metrics to truly see what’s driving the issue. With ClickUp Forms , you can survey customers and employees to find out what problems are present and what may be causing them. These Forms are completely customizable, letting you collect the specific data you need. Plus, they’re easy to share, allowing you to cast a wide net to gather as much information as possible.
Once you’re in the analysis stage, ClickUp’s Table view will be your best friend. Create spreadsheets in seconds and design visual databases of information. Use these views to analyze your data and lay the groundwork for next steps to correct the problem. 🤩
ClickUp best features
- ClickUp AI features hundreds of tools for various use cases, identifying issues and brainstorming solutions
- Use Docs from ClickUp to easily document your RCA process and keep track of important insights and potential next steps
- More than 1,000 templates, including ClickUp’s Root Cause Analysis Template , make it easy to do your work faster and more efficiently

ClickUp limitations
- Right now, ClickUp AI writing tools are only available on desktop, but mobile rollout is on the way
- The sheer number of features requires some time to learn, but once you do, you’ll be able to create more powerful processes
ClickUp pricing
- Free Forever
- Unlimited : $7/month per user
- Business : $12/month per user
- Enterprise : Contact for pricing
- ClickUp Brain is available on all paid plans for $7 per Workspace member per month
ClickUp ratings and reviews
- G2 : 4.7/5 (2,000+ reviews)
- Capterra : 4.7/5 (2,000+ reviews)

The Root Cause Analysis Software from Intelex is a SaaS tool designed to help companies create better environment, health, safety, and quality (EHSC) procedures. It uses various methodologies to get to the root cause of the problem.
Start by recording incident data in the tool where everyone on the team can access and analyze the information. Next, use methodology tools like Ishikawa diagrams and failure mode and effects analysis (FMEA) to identify trends.
Intelex best features
- Integrated RCA techniques, including 5 whys, checklists, and gap analysis, make it easy to assess problems in one space
- Workflow tools feature integrations to identify the root causes of problems outside your organization when they occur
- Custom dashboards and reporting make sharing insights with various team members easier than ever
Intelex limitations
- Some users felt the tool was rigid and that data collection features could be more insightful
- The user interface isn’t the most friendly, particularly for beginners
Intelex pricing
- Free: seven-day trial
- Custom : Contact for pricing
Intelex ratings and reviews
- G2 : 4/5 (10+ reviews)
- Capterra : N/A

Apache Skywalking is an application performance management (APM) tool designed to identify issues in software tools. Specifically made for microservices, cloud, and Kubernetes applications, this tool is useful for software engineers in charge of tech teams. 👨🏽💻
Apache Skywalking best features
- Profile codes on runtime using the built-in root causes analysis features that identify the exact point where issues develop
- Performance optimization tools let you create continuous improvement processes to better meet customer needs
- In-depth metrics and root cause analysis templates to get to the heart of the problem, so your team can brainstorm solutions
Apache Skywalking limitations
- The complex interface may be intimidating, particularly for entry-level team members
- Some found the tool was better suited for smaller-scale projects
Apache Skywalking pricing
- Free (open source tool)
Apache Skywalking ratings and reviews
Bonus: Check out The Best Open-Source Project Management Tools in 2024

TapRooT® is a software tool designed to identify and fix problems caused by both equipment and humans. Use this tool to collect evidence of the issue, identify the cause and effect of various actors, and develop fixes.
TapRooT® best features
- Processes are differentiated based on whether it’s a simple incident or a major accident, so you react accordingly
- The Corrective Action Helper® Guide/Module leads you through potential solutions and makes implementation faster
- Charts and graphs organize data so it’s easier to identify trends
TapRooT® limitations
- Some users found the pricing to be high
- The tool is extremely in-depth, making it a better choice for big businesses
TapRooT® pricing
- Contact for pricing
TapRooT® ratings and reviews

AppDynamics is a tech tool from Cisco that’s designed to identify the root causes of issues across your business. Use it to break down problems in software, applications, user experience, and overall business health. The tool lets you gain visibility, gather data, and automate solutions. 📚
AppDynamics best features
- Extensive supported technologies, including Apache, Python, and Docker
- Monitoring and migration tools make implementing solutions faster
- Application flow maps let you pinpoint the exact moment issues arise
AppDynamics limitations
- A steep learning curve means you have to allocate resources to get the team up to speed
- Complicated licensing and limited data security features
AppDynamics pricing
- Infrastructure Monitoring Edition : $6/month/CPU Core
- Premium Edition : $60/month/CPU Core
- Enterprise Edition : $90/month/CPU Core
- Enterprise Edition for SAP® Solutions : $167/month/CPU Core
- Real User Monitoring : $0.06/month per 1,000 tokens
AppDynamics ratings and reviews
- G2 : 4.3/5 (300+ reviews)
- Capterra : 4.5/5 (30+ reviews)

Causelink® is Sologic’s RCA tool. It uses techniques like 5 whys, fishbone diagrams, and incident timelines to pinpoint the root cause of a problem. Use it as an individual, team, or enterprise tool based on the size of your business.
Sologic best features
- Virtual RCA training features make it easy to provide professional development opportunities for all team members
- Multiple built-in techniques let you analyze data in ways that make the most sense for your business
- The built-in five-step method takes the guesswork out of RCA
Sologic limitations
- Since the tool features built-in methodologies, there isn’t as much customization as with other tools
- Pricing can be expensive, making it harder for small businesses to use
Sologic pricing
- Causelink® Individual : $384/year
- Causelink® Team : Contact for pricing
- Causelink® Enterprise : Contact for pricing
Sologic ratings and reviews
- G2 : 4/5 (1+ reviews)
A major benefit to using root cause analysis tools is that they’re designed to help teams integrate proven techniques into their daily processes. There are a ton of ways to get to the root of a problem, especially when you consider the range of issues teams face across industries.
If you’re searching for a new strategy or wondering what root cause analysis technique will best fit your team’s needs, start here with a few of our favorite examples:
Pareto Chart
Also called Pareto analysis, this RCA tool is a simple bar chart that ranks data based on frequency. It’s useful for identifying problems that cause the most downtime and highlighting where you should focus your efforts. The main purpose of a Pareto Chart is to separate minor problems from major ones. Teams turn to Pareto charts and analysis to:
- Simplify the problem-solving process
- Look for a singular cause to hone in on the root issue
- Highlight the most commonly felt problems
The 5 Whys method is an investigative tool that’s much like a child repeatedly asking, “Why?” 🤔
That might be frustrating in other areas of life, but it’s great for root cause analysis because it pushes you to consider what’s behind a problem.
This tool isn’t meant for quantitative analysis; it’s more for a qualitative approach to finding out what’s behind an issue. It’s a mental exercise that limits your focus on one potential issue and encourages you to identify multiple contributors to that problem. The idea is to ask why-type questions about the problem to understand what’s wrong and why it may not be working.
Fishbone Diagram
This root cause analysis method is named for the shape of the diagram. It’s a process that breaks down problems into subcategories like machine, method, and materials. 🐟
Use fishbone diagram templates when you have no idea what’s behind the issue and need to do a big brainstorm. This strategy can be used for both simple and complex problems by breaking down each subcategory further and further until you nail down the root cause.
Scatter Plot Diagram
A scatter diagram helps you analyze the correlation of two sets of data. An independent variable (or potential cause) is plotted on the x-axis, while a dependent variable (the observed effect) is plotted on the y-axis. If the dots are grouped to create a line, this means there is a relationship between the two.
By clearly identifying the cause and effect based on data, you can implement solutions quickly and efficiently—even when using data points that may initially seem unrelated to each other.
With these root cause analysis tools and methods, finding the problem and creating solutions is easier than ever. Choose one tool or mix and match a few depending on your business needs.
Sign up for ClickUp today to start gathering metrics, identifying problems, and creating solutions in your processes. With AI insights, Whiteboards, and Forms, quickly brainstorm ideas on what’s behind the issue and work collaboratively with your team.
Once you identify the problem, ClickUp makes it easy to instantly assign tasks and create a schedule for implementing solutions. 🏆
Questions? Comments? Visit our Help Center for support.
Receive the latest WriteClick Newsletter updates.
Thanks for subscribing to our blog!
Please enter a valid email
- Free training & 24-hour support
- Serious about security & privacy
- 99.99% uptime the last 12 months
40 problem-solving techniques and processes

All teams and organizations encounter challenges. Approaching those challenges without a structured problem solving process can end up making things worse.
Proven problem solving techniques such as those outlined below can guide your group through a process of identifying problems and challenges , ideating on possible solutions , and then evaluating and implementing the most suitable .
In this post, you'll find problem-solving tools you can use to develop effective solutions. You'll also find some tips for facilitating the problem solving process and solving complex problems.
Design your next session with SessionLab
Join the 150,000+ facilitators using SessionLab.
Recommended Articles
A step-by-step guide to planning a workshop, 54 great online tools for workshops and meetings, how to create an unforgettable training session in 8 simple steps.
- 18 Free Facilitation Resources We Think You’ll Love
What is problem solving?
Problem solving is a process of finding and implementing a solution to a challenge or obstacle. In most contexts, this means going through a problem solving process that begins with identifying the issue, exploring its root causes, ideating and refining possible solutions before implementing and measuring the impact of that solution.
For simple or small problems, it can be tempting to skip straight to implementing what you believe is the right solution. The danger with this approach is that without exploring the true causes of the issue, it might just occur again or your chosen solution may cause other issues.
Particularly in the world of work, good problem solving means using data to back up each step of the process, bringing in new perspectives and effectively measuring the impact of your solution.
Effective problem solving can help ensure that your team or organization is well positioned to overcome challenges, be resilient to change and create innovation. In my experience, problem solving is a combination of skillset, mindset and process, and it’s especially vital for leaders to cultivate this skill.

What is the seven step problem solving process?
A problem solving process is a step-by-step framework from going from discovering a problem all the way through to implementing a solution.
With practice, this framework can become intuitive, and innovative companies tend to have a consistent and ongoing ability to discover and tackle challenges when they come up.
You might see everything from a four step problem solving process through to seven steps. While all these processes cover roughly the same ground, I’ve found a seven step problem solving process is helpful for making all key steps legible.
We’ll outline that process here and then follow with techniques you can use to explore and work on that step of the problem solving process with a group.
The seven-step problem solving process is:
1. Problem identification
The first stage of any problem solving process is to identify the problem(s) you need to solve. This often looks like using group discussions and activities to help a group surface and effectively articulate the challenges they’re facing and wish to resolve.
Be sure to align with your team on the exact definition and nature of the problem you’re solving. An effective process is one where everyone is pulling in the same direction – ensure clarity and alignment now to help avoid misunderstandings later.
2. Problem analysis and refinement
The process of problem analysis means ensuring that the problem you are seeking to solve is the right problem . Choosing the right problem to solve means you are on the right path to creating the right solution.
At this stage, you may look deeper at the problem you identified to try and discover the root cause at the level of people or process. You may also spend some time sourcing data, consulting relevant parties and creating and refining a problem statement.
Problem refinement means adjusting scope or focus of the problem you will be aiming to solve based on what comes up during your analysis. As you analyze data sources, you might discover that the root cause means you need to adjust your problem statement. Alternatively, you might find that your original problem statement is too big to be meaningful approached within your current project.
Remember that the goal of any problem refinement is to help set the stage for effective solution development and deployment. Set the right focus and get buy-in from your team here and you’ll be well positioned to move forward with confidence.
3. Solution generation
Once your group has nailed down the particulars of the problem you wish to solve, you want to encourage a free flow of ideas connecting to solving that problem. This can take the form of problem solving games that encourage creative thinking or techniquess designed to produce working prototypes of possible solutions.
The key to ensuring the success of this stage of the problem solving process is to encourage quick, creative thinking and create an open space where all ideas are considered. The best solutions can often come from unlikely places and by using problem solving techniques that celebrate invention, you might come up with solution gold.
4. Solution development
No solution is perfect right out of the gate. It’s important to discuss and develop the solutions your group has come up with over the course of following the previous problem solving steps in order to arrive at the best possible solution. Problem solving games used in this stage involve lots of critical thinking, measuring potential effort and impact, and looking at possible solutions analytically.
During this stage, you will often ask your team to iterate and improve upon your front-running solutions and develop them further. Remember that problem solving strategies always benefit from a multitude of voices and opinions, and not to let ego get involved when it comes to choosing which solutions to develop and take further.
Finding the best solution is the goal of all problem solving workshops and here is the place to ensure that your solution is well thought out, sufficiently robust and fit for purpose.
5. Decision making and planning
Nearly there! Once you’ve got a set of possible, you’ll need to make a decision on which to implement. This can be a consensus-based group decision or it might be for a leader or major stakeholder to decide. You’ll find a set of effective decision making methods below.
Once your group has reached consensus and selected a solution, there are some additional actions that also need to be decided upon. You’ll want to work on allocating ownership of the project, figure out who will do what, how the success of the solution will be measured and decide the next course of action.
Set clear accountabilities, actions, timeframes, and follow-ups for your chosen solution. Make these decisions and set clear next-steps in the problem solving workshop so that everyone is aligned and you can move forward effectively as a group.
Ensuring that you plan for the roll-out of a solution is one of the most important problem solving steps. Without adequate planning or oversight, it can prove impossible to measure success or iterate further if the problem was not solved.
6. Solution implementation
This is what we were waiting for! All problem solving processes have the end goal of implementing an effective and impactful solution that your group has confidence in.
Project management and communication skills are key here – your solution may need to adjust when out in the wild or you might discover new challenges along the way. For some solutions, you might also implement a test with a small group and monitor results before rolling it out to an entire company.
You should have a clear owner for your solution who will oversee the plans you made together and help ensure they’re put into place. This person will often coordinate the implementation team and set-up processes to measure the efficacy of your solution too.
7. Solution evaluation
So you and your team developed a great solution to a problem and have a gut feeling it’s been solved. Work done, right? Wrong. All problem solving strategies benefit from evaluation, consideration, and feedback.
You might find that the solution does not work for everyone, might create new problems, or is potentially so successful that you will want to roll it out to larger teams or as part of other initiatives.
None of that is possible without taking the time to evaluate the success of the solution you developed in your problem solving model and adjust if necessary.
Remember that the problem solving process is often iterative and it can be common to not solve complex issues on the first try. Even when this is the case, you and your team will have generated learning that will be important for future problem solving workshops or in other parts of the organization.
It’s also worth underlining how important record keeping is throughout the problem solving process. If a solution didn’t work, you need to have the data and records to see why that was the case. If you go back to the drawing board, notes from the previous workshop can help save time.
What does an effective problem solving process look like?
Every effective problem solving process begins with an agenda . In our experience, a well-structured problem solving workshop is one of the best methods for successfully guiding a group from exploring a problem to implementing a solution.
The format of a workshop ensures that you can get buy-in from your group, encourage free-thinking and solution exploration before making a decision on what to implement following the session.
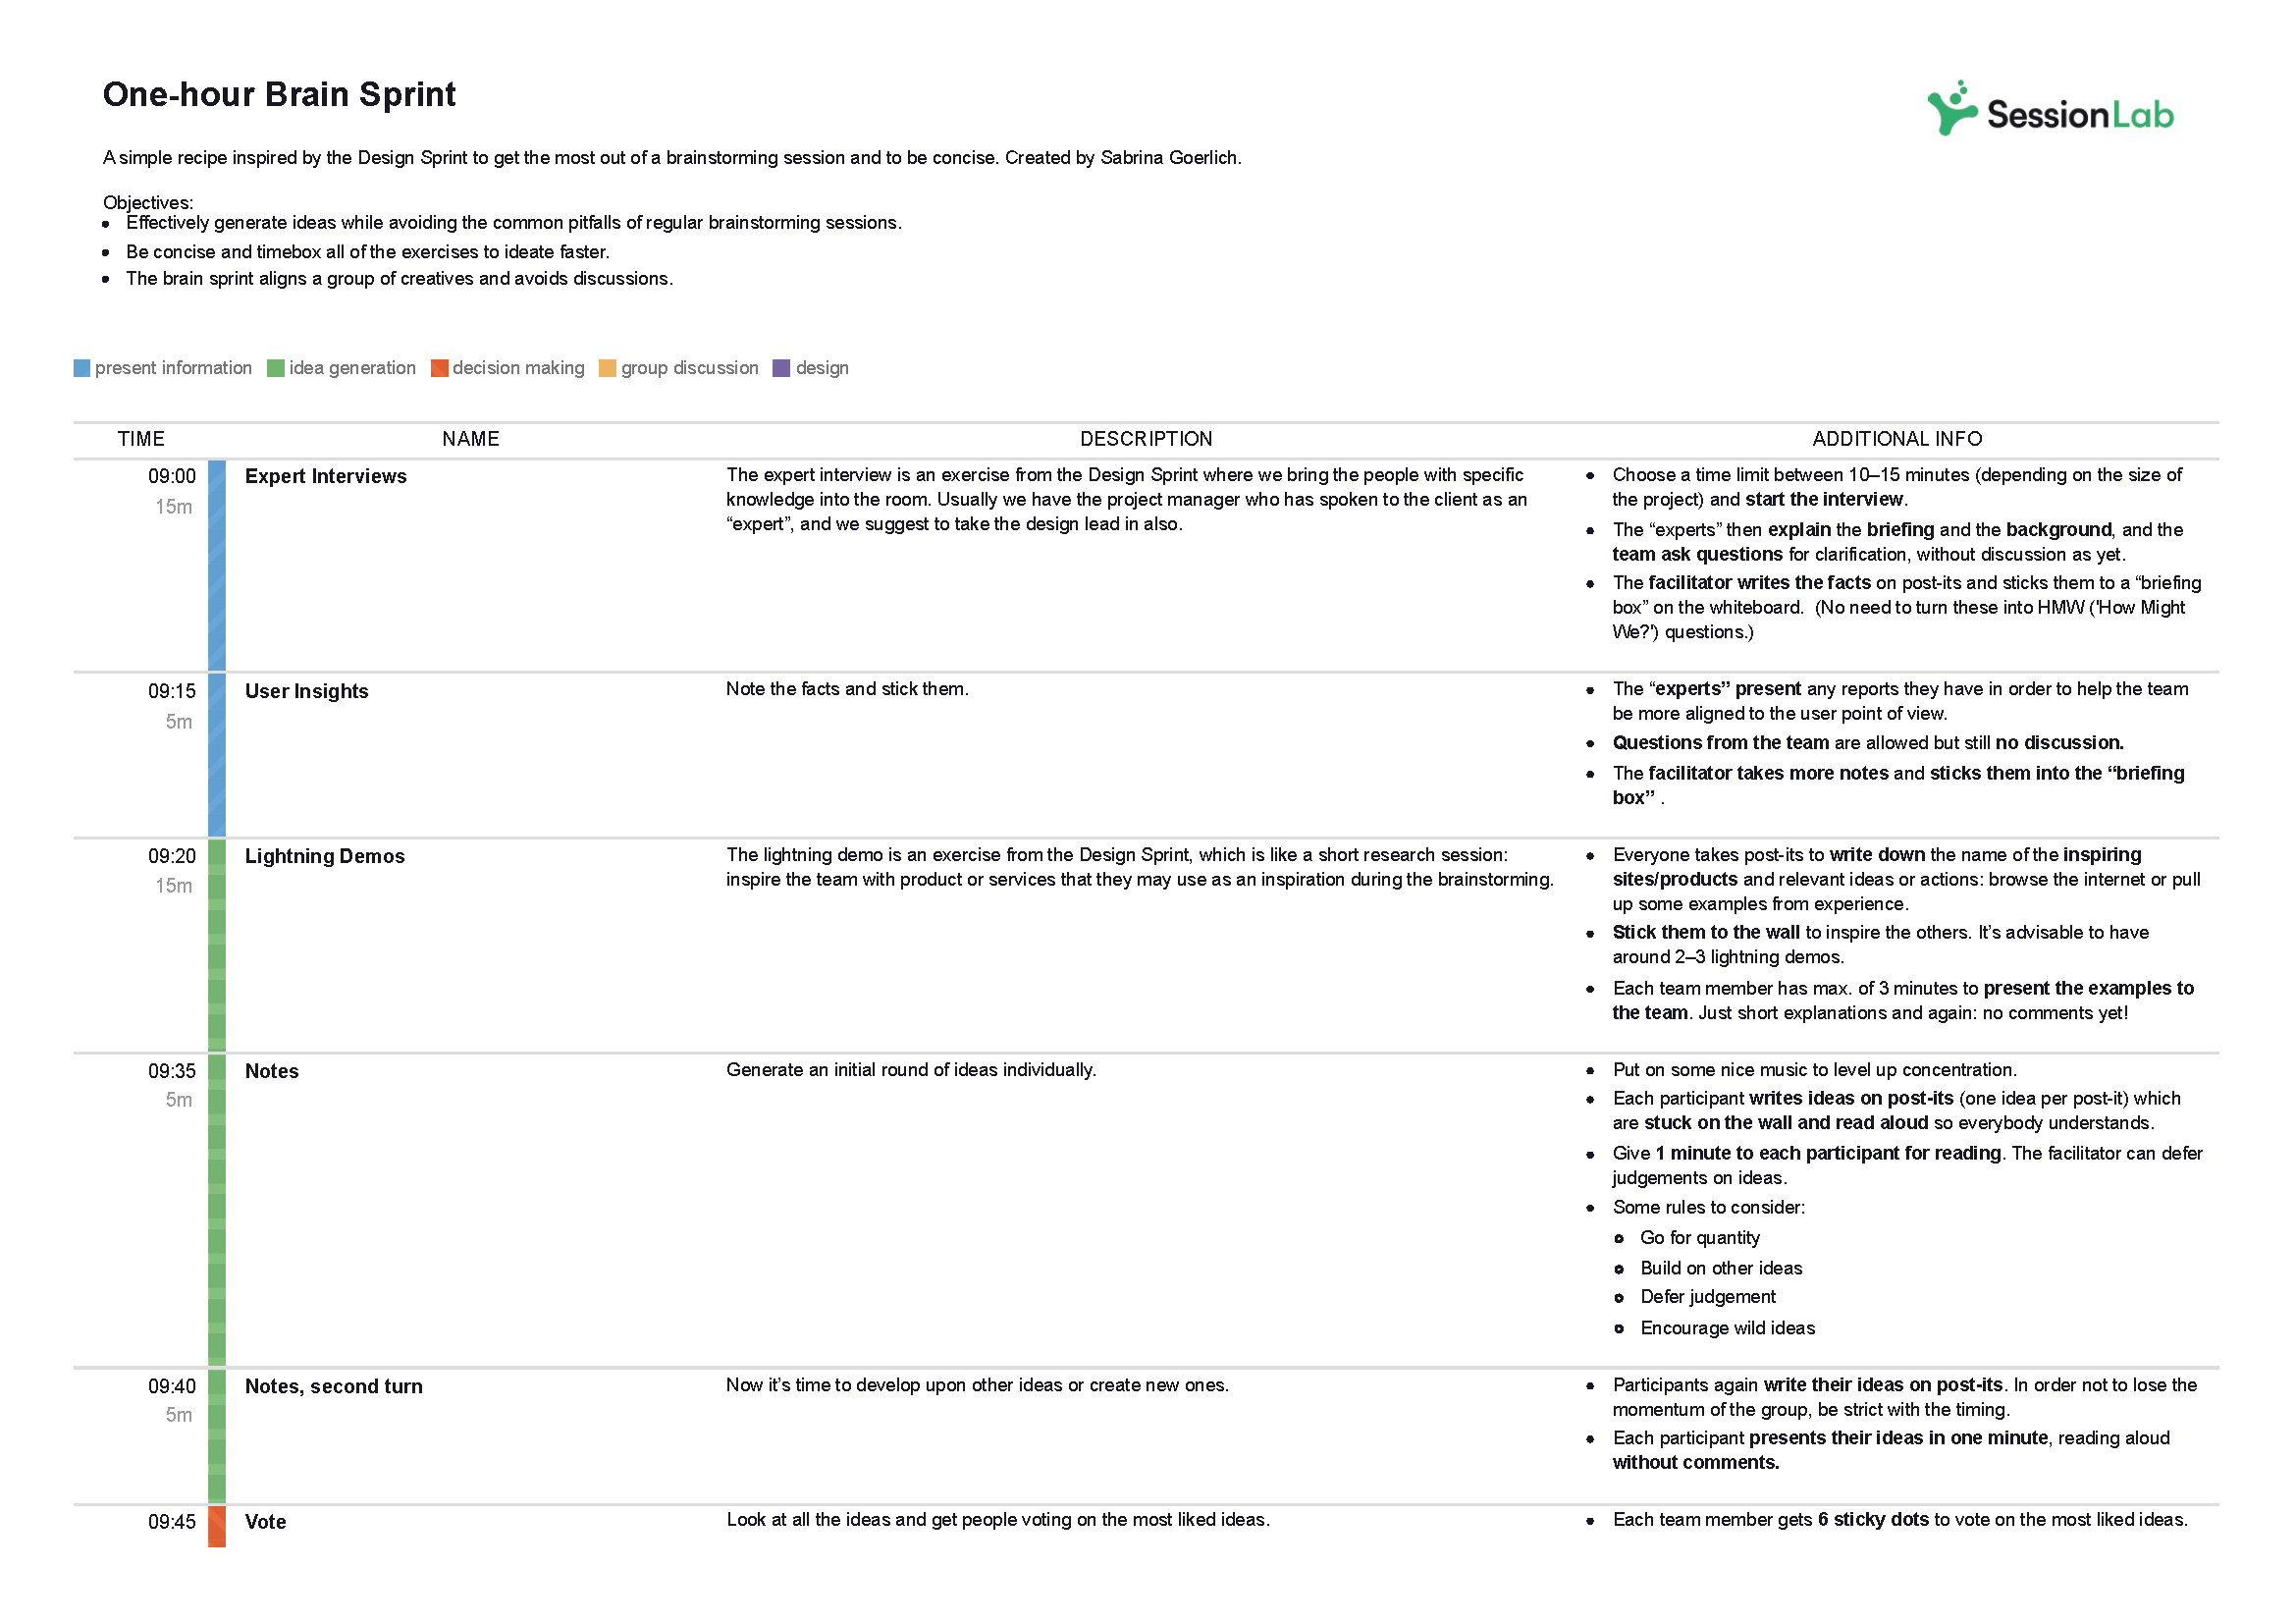
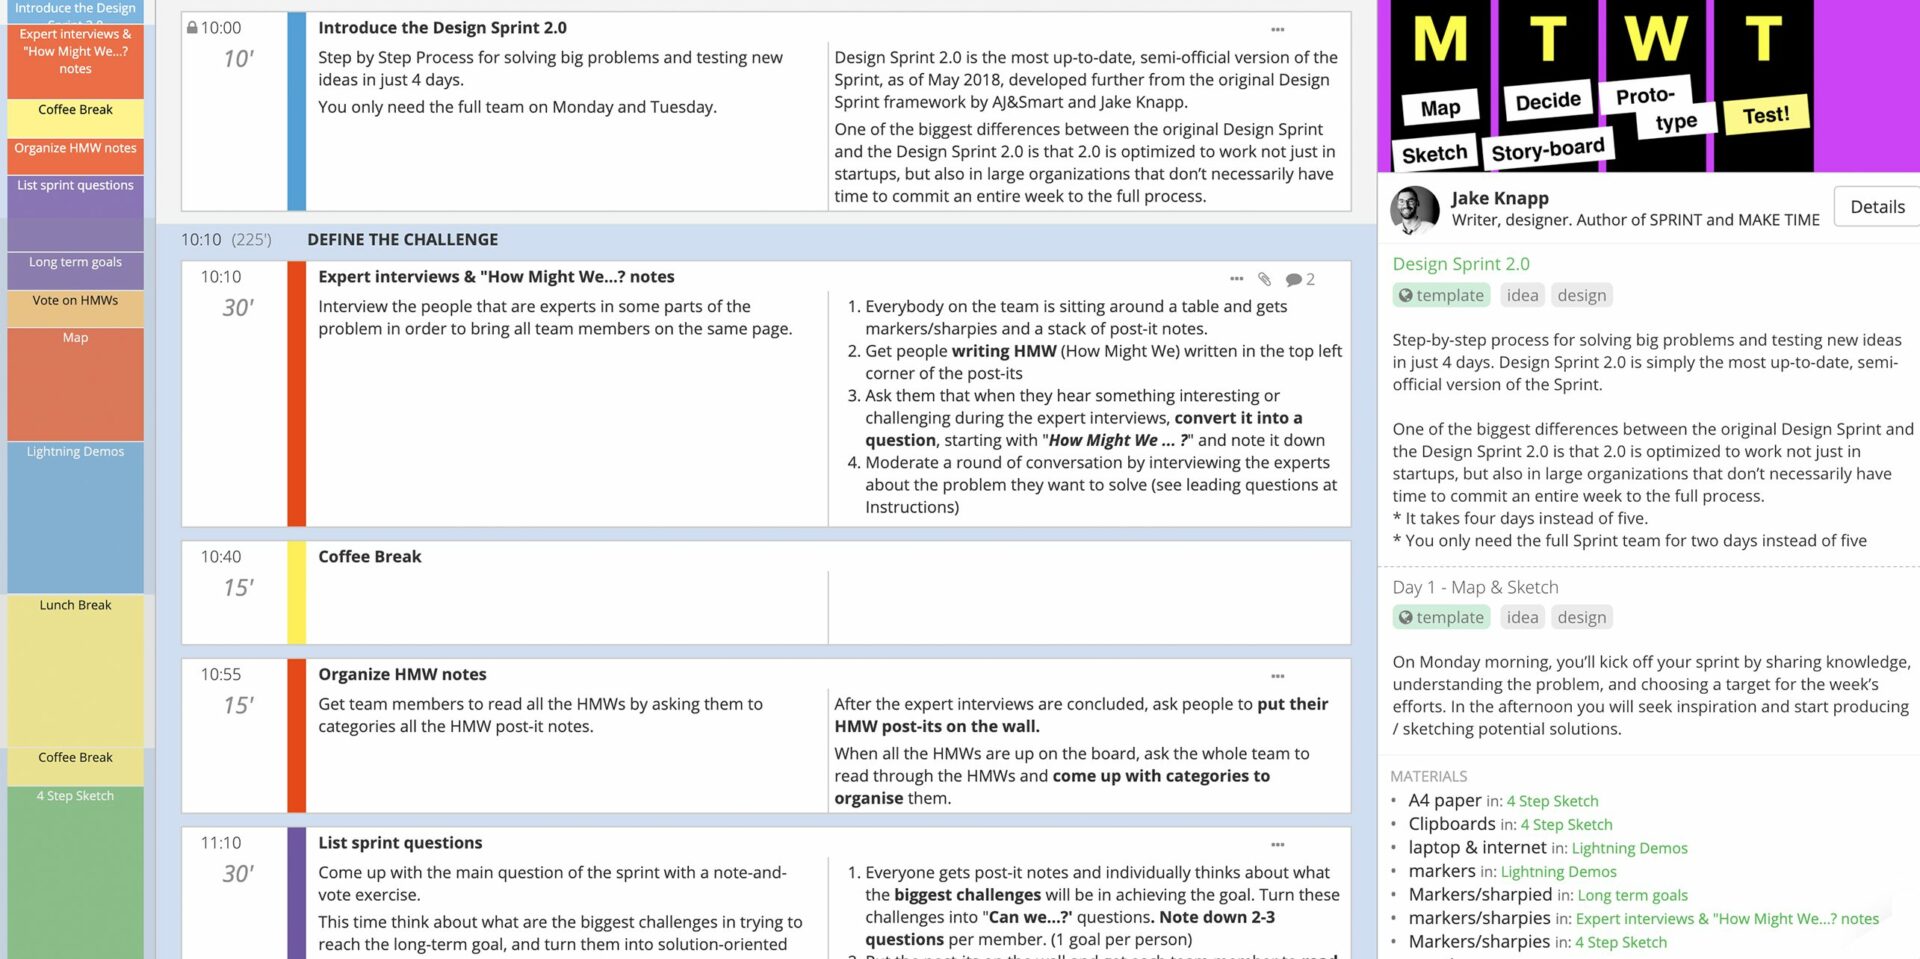
This Design Sprint 2.0 template is an effective problem solving process from top agency AJ&Smart. It’s a great format for the entire problem solving process, with four-days of workshops designed to surface issues, explore solutions and even test a solution.
Check it for an example of how you might structure and run a problem solving process and feel free to copy and adjust it your needs!
For a shorter process you can run in a single afternoon, this remote problem solving agenda will guide you effectively in just a couple of hours.
Whatever the length of your workshop, by using SessionLab, it’s easy to go from an idea to a complete agenda . Start by dragging and dropping your core problem solving activities into place . Add timings, breaks and necessary materials before sharing your agenda with your colleagues.
The resulting agenda will be your guide to an effective and productive problem solving session that will also help you stay organized on the day!
Complete problem-solving methods
In this section, we’ll look at in-depth problem-solving methods that provide a complete end-to-end process for developing effective solutions. These will help guide your team from the discovery and definition of a problem through to delivering the right solution.
If you’re looking for an all-encompassing method or problem-solving model, these processes are a great place to start. They’ll ask your team to challenge preconceived ideas and adopt a mindset for solving problems more effectively.
Six Thinking Hats
Individual approaches to solving a problem can be very different based on what team or role an individual holds. It can be easy for existing biases or perspectives to find their way into the mix, or for internal politics to direct a conversation.
Six Thinking Hats is a classic method for identifying the problems that need to be solved and enables your team to consider them from different angles, whether that is by focusing on facts and data, creative solutions, or by considering why a particular solution might not work.
Like all problem-solving frameworks, Six Thinking Hats is effective at helping teams remove roadblocks from a conversation or discussion and come to terms with all the aspects necessary to solve complex problems.
The Six Thinking Hats #creative thinking #meeting facilitation #problem solving #issue resolution #idea generation #conflict resolution The Six Thinking Hats are used by individuals and groups to separate out conflicting styles of thinking. They enable and encourage a group of people to think constructively together in exploring and implementing change, rather than using argument to fight over who is right and who is wrong.
Lightning Decision Jam
Featured courtesy of Jonathan Courtney of AJ&Smart Berlin, Lightning Decision Jam is one of those strategies that should be in every facilitation toolbox. Exploring problems and finding solutions is often creative in nature, though as with any creative process, there is the potential to lose focus and get lost.
Unstructured discussions might get you there in the end, but it’s much more effective to use a method that creates a clear process and team focus.
In Lightning Decision Jam, participants are invited to begin by writing challenges, concerns, or mistakes on post-its without discussing them before then being invited by the moderator to present them to the group.
From there, the team vote on which problems to solve and are guided through steps that will allow them to reframe those problems, create solutions and then decide what to execute on.
By deciding the problems that need to be solved as a team before moving on, this group process is great for ensuring the whole team is aligned and can take ownership over the next stages.
Lightning Decision Jam (LDJ) #action #decision making #problem solving #issue analysis #innovation #design #remote-friendly It doesn’t matter where you work and what your job role is, if you work with other people together as a team, you will always encounter the same challenges: Unclear goals and miscommunication that cause busy work and overtime Unstructured meetings that leave attendants tired, confused and without clear outcomes. Frustration builds up because internal challenges to productivity are not addressed Sudden changes in priorities lead to a loss of focus and momentum Muddled compromise takes the place of clear decision- making, leaving everybody to come up with their own interpretation. In short, a lack of structure leads to a waste of time and effort, projects that drag on for too long and frustrated, burnt out teams. AJ&Smart has worked with some of the most innovative, productive companies in the world. What sets their teams apart from others is not better tools, bigger talent or more beautiful offices. The secret sauce to becoming a more productive, more creative and happier team is simple: Replace all open discussion or brainstorming with a structured process that leads to more ideas, clearer decisions and better outcomes. When a good process provides guardrails and a clear path to follow, it becomes easier to come up with ideas, make decisions and solve problems. This is why AJ&Smart created Lightning Decision Jam (LDJ). It’s a simple and short, but powerful group exercise that can be run either in-person, in the same room, or remotely with distributed teams.
Problem Definition Process
While problems can be complex, the problem-solving methods you use to identify and solve those problems can often be simple in design.
By taking the time to truly identify and define a problem before asking the group to reframe the challenge as an opportunity, this method is a great way to enable change.
Begin by identifying a focus question and exploring the ways in which it manifests before splitting into five teams who will each consider the problem using a different method: escape, reversal, exaggeration, distortion or wishful. Teams develop a problem objective and create ideas in line with their method before then feeding them back to the group.
This method is great for enabling in-depth discussions while also creating space for finding creative solutions too!
Problem Definition #problem solving #idea generation #creativity #online #remote-friendly A problem solving technique to define a problem, challenge or opportunity and to generate ideas.
The 5 Whys
Sometimes, a group needs to go further with their strategies and analyze the root cause at the heart of organizational issues. An RCA or root cause analysis is the process of identifying what is at the heart of business problems or recurring challenges.
The 5 Whys is a simple and effective method of helping a group go find the root cause of any problem or challenge and conduct analysis that will deliver results.
By beginning with the creation of a problem statement and going through five stages to refine it, The 5 Whys provides everything you need to truly discover the cause of an issue.
The 5 Whys #hyperisland #innovation This simple and powerful method is useful for getting to the core of a problem or challenge. As the title suggests, the group defines a problems, then asks the question “why” five times, often using the resulting explanation as a starting point for creative problem solving.
World Cafe is a simple but powerful facilitation technique to help bigger groups to focus their energy and attention on solving complex problems.
World Cafe enables this approach by creating a relaxed atmosphere where participants are able to self-organize and explore topics relevant and important to them which are themed around a central problem-solving purpose. Create the right atmosphere by modeling your space after a cafe and after guiding the group through the method, let them take the lead!
Making problem-solving a part of your organization’s culture in the long term can be a difficult undertaking. More approachable formats like World Cafe can be especially effective in bringing people unfamiliar with workshops into the fold.
World Cafe #hyperisland #innovation #issue analysis World Café is a simple yet powerful method, originated by Juanita Brown, for enabling meaningful conversations driven completely by participants and the topics that are relevant and important to them. Facilitators create a cafe-style space and provide simple guidelines. Participants then self-organize and explore a set of relevant topics or questions for conversation.
Discovery & Action Dialogue (DAD)
One of the best approaches is to create a safe space for a group to share and discover practices and behaviors that can help them find their own solutions.
With DAD, you can help a group choose which problems they wish to solve and which approaches they will take to do so. It’s great at helping remove resistance to change and can help get buy-in at every level too!
This process of enabling frontline ownership is great in ensuring follow-through and is one of the methods you will want in your toolbox as a facilitator.
Discovery & Action Dialogue (DAD) #idea generation #liberating structures #action #issue analysis #remote-friendly DADs make it easy for a group or community to discover practices and behaviors that enable some individuals (without access to special resources and facing the same constraints) to find better solutions than their peers to common problems. These are called positive deviant (PD) behaviors and practices. DADs make it possible for people in the group, unit, or community to discover by themselves these PD practices. DADs also create favorable conditions for stimulating participants’ creativity in spaces where they can feel safe to invent new and more effective practices. Resistance to change evaporates as participants are unleashed to choose freely which practices they will adopt or try and which problems they will tackle. DADs make it possible to achieve frontline ownership of solutions.
Design Sprint 2.0
Want to see how a team can solve big problems and move forward with prototyping and testing solutions in a few days? The Design Sprint 2.0 template from Jake Knapp, author of Sprint, is a complete agenda for a with proven results.
Developing the right agenda can involve difficult but necessary planning. Ensuring all the correct steps are followed can also be stressful or time-consuming depending on your level of experience.
Use this complete 4-day workshop template if you are finding there is no obvious solution to your challenge and want to focus your team around a specific problem that might require a shortcut to launching a minimum viable product or waiting for the organization-wide implementation of a solution.
Open space technology
Open space technology- developed by Harrison Owen – creates a space where large groups are invited to take ownership of their problem solving and lead individual sessions. Open space technology is a great format when you have a great deal of expertise and insight in the room and want to allow for different takes and approaches on a particular theme or problem you need to be solved.
Start by bringing your participants together to align around a central theme and focus their efforts. Explain the ground rules to help guide the problem-solving process and then invite members to identify any issue connecting to the central theme that they are interested in and are prepared to take responsibility for.
Once participants have decided on their approach to the core theme, they write their issue on a piece of paper, announce it to the group, pick a session time and place, and post the paper on the wall. As the wall fills up with sessions, the group is then invited to join the sessions that interest them the most and which they can contribute to, then you’re ready to begin!
Everyone joins the problem-solving group they’ve signed up to, record the discussion and if appropriate, findings can then be shared with the rest of the group afterward.
Open Space Technology #action plan #idea generation #problem solving #issue analysis #large group #online #remote-friendly Open Space is a methodology for large groups to create their agenda discerning important topics for discussion, suitable for conferences, community gatherings and whole system facilitation
Techniques to identify and analyze problems
Using a problem-solving method to help a team identify and analyze a problem can be a quick and effective addition to any workshop or meeting.
While further actions are always necessary, you can generate momentum and alignment easily, and these activities are a great place to get started.
We’ve put together this list of techniques to help you and your team with problem identification, analysis, and discussion that sets the foundation for developing effective solutions.
Let’s take a look!
Fishbone Analysis
Organizational or team challenges are rarely simple, and it’s important to remember that one problem can be an indication of something that goes deeper and may require further consideration to be solved.
Fishbone Analysis helps groups to dig deeper and understand the origins of a problem. It’s a great example of a root cause analysis method that is simple for everyone on a team to get their head around.
Participants in this activity are asked to annotate a diagram of a fish, first adding the problem or issue to be worked on at the head of a fish before then brainstorming the root causes of the problem and adding them as bones on the fish.
Using abstractions such as a diagram of a fish can really help a team break out of their regular thinking and develop a creative approach.
Fishbone Analysis #problem solving ##root cause analysis #decision making #online facilitation A process to help identify and understand the origins of problems, issues or observations.
Problem Tree
Encouraging visual thinking can be an essential part of many strategies. By simply reframing and clarifying problems, a group can move towards developing a problem solving model that works for them.
In Problem Tree, groups are asked to first brainstorm a list of problems – these can be design problems, team problems or larger business problems – and then organize them into a hierarchy. The hierarchy could be from most important to least important or abstract to practical, though the key thing with problem solving games that involve this aspect is that your group has some way of managing and sorting all the issues that are raised.
Once you have a list of problems that need to be solved and have organized them accordingly, you’re then well-positioned for the next problem solving steps.
Problem tree #define intentions #create #design #issue analysis A problem tree is a tool to clarify the hierarchy of problems addressed by the team within a design project; it represents high level problems or related sublevel problems.
SWOT Analysis
Chances are you’ve heard of the SWOT Analysis before. This problem-solving method focuses on identifying strengths, weaknesses, opportunities, and threats is a tried and tested method for both individuals and teams.
Start by creating a desired end state or outcome and bare this in mind – any process solving model is made more effective by knowing what you are moving towards. Create a quadrant made up of the four categories of a SWOT analysis and ask participants to generate ideas based on each of those quadrants.
Once you have those ideas assembled in their quadrants, cluster them together based on their affinity with other ideas. These clusters are then used to facilitate group conversations and move things forward.
SWOT analysis #gamestorming #problem solving #action #meeting facilitation The SWOT Analysis is a long-standing technique of looking at what we have, with respect to the desired end state, as well as what we could improve on. It gives us an opportunity to gauge approaching opportunities and dangers, and assess the seriousness of the conditions that affect our future. When we understand those conditions, we can influence what comes next.
Agreement-Certainty Matrix
Not every problem-solving approach is right for every challenge, and deciding on the right method for the challenge at hand is a key part of being an effective team.
The Agreement Certainty matrix helps teams align on the nature of the challenges facing them. By sorting problems from simple to chaotic, your team can understand what methods are suitable for each problem and what they can do to ensure effective results.
If you are already using Liberating Structures techniques as part of your problem-solving strategy, the Agreement-Certainty Matrix can be an invaluable addition to your process. We’ve found it particularly if you are having issues with recurring problems in your organization and want to go deeper in understanding the root cause.
Agreement-Certainty Matrix #issue analysis #liberating structures #problem solving You can help individuals or groups avoid the frequent mistake of trying to solve a problem with methods that are not adapted to the nature of their challenge. The combination of two questions makes it possible to easily sort challenges into four categories: simple, complicated, complex , and chaotic . A problem is simple when it can be solved reliably with practices that are easy to duplicate. It is complicated when experts are required to devise a sophisticated solution that will yield the desired results predictably. A problem is complex when there are several valid ways to proceed but outcomes are not predictable in detail. Chaotic is when the context is too turbulent to identify a path forward. A loose analogy may be used to describe these differences: simple is like following a recipe, complicated like sending a rocket to the moon, complex like raising a child, and chaotic is like the game “Pin the Tail on the Donkey.” The Liberating Structures Matching Matrix in Chapter 5 can be used as the first step to clarify the nature of a challenge and avoid the mismatches between problems and solutions that are frequently at the root of chronic, recurring problems.
Organizing and charting a team’s progress can be important in ensuring its success. SQUID (Sequential Question and Insight Diagram) is a great model that allows a team to effectively switch between giving questions and answers and develop the skills they need to stay on track throughout the process.
Begin with two different colored sticky notes – one for questions and one for answers – and with your central topic (the head of the squid) on the board. Ask the group to first come up with a series of questions connected to their best guess of how to approach the topic. Ask the group to come up with answers to those questions, fix them to the board and connect them with a line. After some discussion, go back to question mode by responding to the generated answers or other points on the board.
It’s rewarding to see a diagram grow throughout the exercise, and a completed SQUID can provide a visual resource for future effort and as an example for other teams.
SQUID #gamestorming #project planning #issue analysis #problem solving When exploring an information space, it’s important for a group to know where they are at any given time. By using SQUID, a group charts out the territory as they go and can navigate accordingly. SQUID stands for Sequential Question and Insight Diagram.
To continue with our nautical theme, Speed Boat is a short and sweet activity that can help a team quickly identify what employees, clients or service users might have a problem with and analyze what might be standing in the way of achieving a solution.
Methods that allow for a group to make observations, have insights and obtain those eureka moments quickly are invaluable when trying to solve complex problems.
In Speed Boat, the approach is to first consider what anchors and challenges might be holding an organization (or boat) back. Bonus points if you are able to identify any sharks in the water and develop ideas that can also deal with competitors!
Speed Boat #gamestorming #problem solving #action Speedboat is a short and sweet way to identify what your employees or clients don’t like about your product/service or what’s standing in the way of a desired goal.
The Journalistic Six
Some of the most effective ways of solving problems is by encouraging teams to be more inclusive and diverse in their thinking.
Based on the six key questions journalism students are taught to answer in articles and news stories, The Journalistic Six helps create teams to see the whole picture. By using who, what, when, where, why, and how to facilitate the conversation and encourage creative thinking, your team can make sure that the problem identification and problem analysis stages of the are covered exhaustively and thoughtfully. Reporter’s notebook and dictaphone optional.
The Journalistic Six – Who What When Where Why How #idea generation #issue analysis #problem solving #online #creative thinking #remote-friendly A questioning method for generating, explaining, investigating ideas.
Individual and group perspectives are incredibly important, but what happens if people are set in their minds and need a change of perspective in order to approach a problem more effectively?
Flip It is a method we love because it is both simple to understand and run, and allows groups to understand how their perspectives and biases are formed.
Participants in Flip It are first invited to consider concerns, issues, or problems from a perspective of fear and write them on a flip chart. Then, the group is asked to consider those same issues from a perspective of hope and flip their understanding.
No problem and solution is free from existing bias and by changing perspectives with Flip It, you can then develop a problem solving model quickly and effectively.
Flip It! #gamestorming #problem solving #action Often, a change in a problem or situation comes simply from a change in our perspectives. Flip It! is a quick game designed to show players that perspectives are made, not born.
LEGO Challenge
Now for an activity that is a little out of the (toy) box. LEGO Serious Play is a facilitation methodology that can be used to improve creative thinking and problem-solving skills.
The LEGO Challenge includes giving each member of the team an assignment that is hidden from the rest of the group while they create a structure without speaking.
What the LEGO challenge brings to the table is a fun working example of working with stakeholders who might not be on the same page to solve problems. Also, it’s LEGO! Who doesn’t love LEGO!
LEGO Challenge #hyperisland #team A team-building activity in which groups must work together to build a structure out of LEGO, but each individual has a secret “assignment” which makes the collaborative process more challenging. It emphasizes group communication, leadership dynamics, conflict, cooperation, patience and problem solving strategy.
What, So What, Now What?
If not carefully managed, the problem identification and problem analysis stages of the problem-solving process can actually create more problems and misunderstandings.
The What, So What, Now What? problem-solving activity is designed to help collect insights and move forward while also eliminating the possibility of disagreement when it comes to identifying, clarifying, and analyzing organizational or work problems.
Facilitation is all about bringing groups together so that might work on a shared goal and the best problem-solving strategies ensure that teams are aligned in purpose, if not initially in opinion or insight.
Throughout the three steps of this game, you give everyone on a team to reflect on a problem by asking what happened, why it is important, and what actions should then be taken.
This can be a great activity for bringing our individual perceptions about a problem or challenge and contextualizing it in a larger group setting. This is one of the most important problem-solving skills you can bring to your organization.
W³ – What, So What, Now What? #issue analysis #innovation #liberating structures You can help groups reflect on a shared experience in a way that builds understanding and spurs coordinated action while avoiding unproductive conflict. It is possible for every voice to be heard while simultaneously sifting for insights and shaping new direction. Progressing in stages makes this practical—from collecting facts about What Happened to making sense of these facts with So What and finally to what actions logically follow with Now What . The shared progression eliminates most of the misunderstandings that otherwise fuel disagreements about what to do. Voila!
Journalists
Problem analysis can be one of the most important and decisive stages of all problem-solving tools. Sometimes, a team can become bogged down in the details and are unable to move forward.
Journalists is an activity that can avoid a group from getting stuck in the problem identification or problem analysis stages of the process.
In Journalists, the group is invited to draft the front page of a fictional newspaper and figure out what stories deserve to be on the cover and what headlines those stories will have. By reframing how your problems and challenges are approached, you can help a team move productively through the process and be better prepared for the steps to follow.
Journalists #vision #big picture #issue analysis #remote-friendly This is an exercise to use when the group gets stuck in details and struggles to see the big picture. Also good for defining a vision.
Problem-solving techniques for brainstorming solutions
Now you have the context and background of the problem you are trying to solving, now comes the time to start ideating and thinking about how you’ll solve the issue.
Here, you’ll want to encourage creative, free thinking and speed. Get as many ideas out as possible and explore different perspectives so you have the raw material for the next step.
Looking at a problem from a new angle can be one of the most effective ways of creating an effective solution. TRIZ is a problem-solving tool that asks the group to consider what they must not do in order to solve a challenge.
By reversing the discussion, new topics and taboo subjects often emerge, allowing the group to think more deeply and create ideas that confront the status quo in a safe and meaningful way. If you’re working on a problem that you’ve tried to solve before, TRIZ is a great problem-solving method to help your team get unblocked.
Making Space with TRIZ #issue analysis #liberating structures #issue resolution You can clear space for innovation by helping a group let go of what it knows (but rarely admits) limits its success and by inviting creative destruction. TRIZ makes it possible to challenge sacred cows safely and encourages heretical thinking. The question “What must we stop doing to make progress on our deepest purpose?” induces seriously fun yet very courageous conversations. Since laughter often erupts, issues that are otherwise taboo get a chance to be aired and confronted. With creative destruction come opportunities for renewal as local action and innovation rush in to fill the vacuum. Whoosh!
Mindspin
Brainstorming is part of the bread and butter of the problem-solving process and all problem-solving strategies benefit from getting ideas out and challenging a team to generate solutions quickly.
With Mindspin, participants are encouraged not only to generate ideas but to do so under time constraints and by slamming down cards and passing them on. By doing multiple rounds, your team can begin with a free generation of possible solutions before moving on to developing those solutions and encouraging further ideation.
This is one of our favorite problem-solving activities and can be great for keeping the energy up throughout the workshop. Remember the importance of helping people become engaged in the process – energizing problem-solving techniques like Mindspin can help ensure your team stays engaged and happy, even when the problems they’re coming together to solve are complex.
MindSpin #teampedia #idea generation #problem solving #action A fast and loud method to enhance brainstorming within a team. Since this activity has more than round ideas that are repetitive can be ruled out leaving more creative and innovative answers to the challenge.
The Creativity Dice
One of the most useful problem solving skills you can teach your team is of approaching challenges with creativity, flexibility, and openness. Games like The Creativity Dice allow teams to overcome the potential hurdle of too much linear thinking and approach the process with a sense of fun and speed.
In The Creativity Dice, participants are organized around a topic and roll a dice to determine what they will work on for a period of 3 minutes at a time. They might roll a 3 and work on investigating factual information on the chosen topic. They might roll a 1 and work on identifying the specific goals, standards, or criteria for the session.
Encouraging rapid work and iteration while asking participants to be flexible are great skills to cultivate. Having a stage for idea incubation in this game is also important. Moments of pause can help ensure the ideas that are put forward are the most suitable.
The Creativity Dice #creativity #problem solving #thiagi #issue analysis Too much linear thinking is hazardous to creative problem solving. To be creative, you should approach the problem (or the opportunity) from different points of view. You should leave a thought hanging in mid-air and move to another. This skipping around prevents premature closure and lets your brain incubate one line of thought while you consciously pursue another.
Idea and Concept Development
Brainstorming without structure can quickly become chaotic or frustrating. In a problem-solving context, having an ideation framework to follow can help ensure your team is both creative and disciplined.
In this method, you’ll find an idea generation process that encourages your group to brainstorm effectively before developing their ideas and begin clustering them together. By using concepts such as Yes and…, more is more and postponing judgement, you can create the ideal conditions for brainstorming with ease.
Idea & Concept Development #hyperisland #innovation #idea generation Ideation and Concept Development is a process for groups to work creatively and collaboratively to generate creative ideas. It’s a general approach that can be adapted and customized to suit many different scenarios. It includes basic principles for idea generation and several steps for groups to work with. It also includes steps for idea selection and development.
Problem-solving techniques for developing and refining solutions
The success of any problem-solving process can be measured by the solutions it produces. After you’ve defined the issue, explored existing ideas, and ideated, it’s time to develop and refine your ideas in order to bring them closer to a solution that actually solves the problem.
Use these problem-solving techniques when you want to help your team think through their ideas and refine them as part of your problem solving process.
Improved Solutions
After a team has successfully identified a problem and come up with a few solutions, it can be tempting to call the work of the problem-solving process complete. That said, the first solution is not necessarily the best, and by including a further review and reflection activity into your problem-solving model, you can ensure your group reaches the best possible result.
One of a number of problem-solving games from Thiagi Group, Improved Solutions helps you go the extra mile and develop suggested solutions with close consideration and peer review. By supporting the discussion of several problems at once and by shifting team roles throughout, this problem-solving technique is a dynamic way of finding the best solution.
Improved Solutions #creativity #thiagi #problem solving #action #team You can improve any solution by objectively reviewing its strengths and weaknesses and making suitable adjustments. In this creativity framegame, you improve the solutions to several problems. To maintain objective detachment, you deal with a different problem during each of six rounds and assume different roles (problem owner, consultant, basher, booster, enhancer, and evaluator) during each round. At the conclusion of the activity, each player ends up with two solutions to her problem.
Four Step Sketch
Creative thinking and visual ideation does not need to be confined to the opening stages of your problem-solving strategies. Exercises that include sketching and prototyping on paper can be effective at the solution finding and development stage of the process, and can be great for keeping a team engaged.
By going from simple notes to a crazy 8s round that involves rapidly sketching 8 variations on their ideas before then producing a final solution sketch, the group is able to iterate quickly and visually. Problem-solving techniques like Four-Step Sketch are great if you have a group of different thinkers and want to change things up from a more textual or discussion-based approach.
Four-Step Sketch #design sprint #innovation #idea generation #remote-friendly The four-step sketch is an exercise that helps people to create well-formed concepts through a structured process that includes: Review key information Start design work on paper, Consider multiple variations , Create a detailed solution . This exercise is preceded by a set of other activities allowing the group to clarify the challenge they want to solve. See how the Four Step Sketch exercise fits into a Design Sprint
Ensuring that everyone in a group is able to contribute to a discussion is vital during any problem solving process. Not only does this ensure all bases are covered, but its then easier to get buy-in and accountability when people have been able to contribute to the process.
1-2-4-All is a tried and tested facilitation technique where participants are asked to first brainstorm on a topic on their own. Next, they discuss and share ideas in a pair before moving into a small group. Those groups are then asked to present the best idea from their discussion to the rest of the team.
This method can be used in many different contexts effectively, though I find it particularly shines in the idea development stage of the process. Giving each participant time to concretize their ideas and develop them in progressively larger groups can create a great space for both innovation and psychological safety.
1-2-4-All #idea generation #liberating structures #issue analysis With this facilitation technique you can immediately include everyone regardless of how large the group is. You can generate better ideas and more of them faster than ever before. You can tap the know-how and imagination that is distributed widely in places not known in advance. Open, generative conversation unfolds. Ideas and solutions are sifted in rapid fashion. Most importantly, participants own the ideas, so follow-up and implementation is simplified. No buy-in strategies needed! Simple and elegant!
15% Solutions
Some problems are simpler than others and with the right problem-solving activities, you can empower people to take immediate actions that can help create organizational change.
Part of the liberating structures toolkit, 15% solutions is a problem-solving technique that focuses on finding and implementing solutions quickly. A process of iterating and making small changes quickly can help generate momentum and an appetite for solving complex problems.
Problem-solving strategies can live and die on whether people are onboard. Getting some quick wins is a great way of getting people behind the process.
It can be extremely empowering for a team to realize that problem-solving techniques can be deployed quickly and easily and delineate between things they can positively impact and those things they cannot change.
15% Solutions #action #liberating structures #remote-friendly You can reveal the actions, however small, that everyone can do immediately. At a minimum, these will create momentum, and that may make a BIG difference. 15% Solutions show that there is no reason to wait around, feel powerless, or fearful. They help people pick it up a level. They get individuals and the group to focus on what is within their discretion instead of what they cannot change. With a very simple question, you can flip the conversation to what can be done and find solutions to big problems that are often distributed widely in places not known in advance. Shifting a few grains of sand may trigger a landslide and change the whole landscape.
Problem-solving techniques for making decisions and planning
After your group is happy with the possible solutions you’ve developed, now comes the time to choose which to implement. There’s more than one way to make a decision and the best option is often dependant on the needs and set-up of your group.
Sometimes, it’s the case that you’ll want to vote as a group on what is likely to be the most impactful solution. Other times, it might be down to a decision maker or major stakeholder to make the final decision. Whatever your process, here’s some techniques you can use to help you make a decision during your problem solving process.
How-Now-Wow Matrix
The problem-solving process is often creative, as complex problems usually require a change of thinking and creative response in order to find the best solutions. While it’s common for the first stages to encourage creative thinking, groups can often gravitate to familiar solutions when it comes to the end of the process.
When selecting solutions, you don’t want to lose your creative energy! The How-Now-Wow Matrix from Gamestorming is a great problem-solving activity that enables a group to stay creative and think out of the box when it comes to selecting the right solution for a given problem.
Problem-solving techniques that encourage creative thinking and the ideation and selection of new solutions can be the most effective in organisational change. Give the How-Now-Wow Matrix a go, and not just for how pleasant it is to say out loud.
How-Now-Wow Matrix #gamestorming #idea generation #remote-friendly When people want to develop new ideas, they most often think out of the box in the brainstorming or divergent phase. However, when it comes to convergence, people often end up picking ideas that are most familiar to them. This is called a ‘creative paradox’ or a ‘creadox’. The How-Now-Wow matrix is an idea selection tool that breaks the creadox by forcing people to weigh each idea on 2 parameters.
Impact and Effort Matrix
All problem-solving techniques hope to not only find solutions to a given problem or challenge but to find the best solution. When it comes to finding a solution, groups are invited to put on their decision-making hats and really think about how a proposed idea would work in practice.
The Impact and Effort Matrix is one of the problem-solving techniques that fall into this camp, empowering participants to first generate ideas and then categorize them into a 2×2 matrix based on impact and effort.
Activities that invite critical thinking while remaining simple are invaluable. Use the Impact and Effort Matrix to move from ideation and towards evaluating potential solutions before then committing to them.
Impact and Effort Matrix #gamestorming #decision making #action #remote-friendly In this decision-making exercise, possible actions are mapped based on two factors: effort required to implement and potential impact. Categorizing ideas along these lines is a useful technique in decision making, as it obliges contributors to balance and evaluate suggested actions before committing to them.
If you’ve followed each of the problem-solving steps with your group successfully, you should move towards the end of your process with heaps of possible solutions developed with a specific problem in mind. But how do you help a group go from ideation to putting a solution into action?
Dotmocracy – or Dot Voting -is a tried and tested method of helping a team in the problem-solving process make decisions and put actions in place with a degree of oversight and consensus.
One of the problem-solving techniques that should be in every facilitator’s toolbox, Dot Voting is fast and effective and can help identify the most popular and best solutions and help bring a group to a decision effectively.
Dotmocracy #action #decision making #group prioritization #hyperisland #remote-friendly Dotmocracy is a simple method for group prioritization or decision-making. It is not an activity on its own, but a method to use in processes where prioritization or decision-making is the aim. The method supports a group to quickly see which options are most popular or relevant. The options or ideas are written on post-its and stuck up on a wall for the whole group to see. Each person votes for the options they think are the strongest, and that information is used to inform a decision.
Straddling the gap between decision making and planning, MoSCoW is a simple and effective method that allows a group team to easily prioritize a set of possible options.
Use this method in a problem solving process by collecting and summarizing all your possible solutions and then categorize them into 4 sections: “Must have”, “Should have”, “Could have”, or “Would like but won‘t get”.
This method is particularly useful when its less about choosing one possible solution and more about prioritorizing which to do first and which may not fit in the scope of your project. In my experience, complex challenges often require multiple small fixes, and this method can be a great way to move from a pile of things you’d all like to do to a structured plan.
MoSCoW #define intentions #create #design #action #remote-friendly MoSCoW is a method that allows the team to prioritize the different features that they will work on. Features are then categorized into “Must have”, “Should have”, “Could have”, or “Would like but won‘t get”. To be used at the beginning of a timeslot (for example during Sprint planning) and when planning is needed.
When it comes to managing the rollout of a solution, clarity and accountability are key factors in ensuring the success of the project. The RAACI chart is a simple but effective model for setting roles and responsibilities as part of a planning session.
Start by listing each person involved in the project and put them into the following groups in order to make it clear who is responsible for what during the rollout of your solution.
- Responsibility (Which person and/or team will be taking action?)
- Authority (At what “point” must the responsible person check in before going further?)
- Accountability (Who must the responsible person check in with?)
- Consultation (Who must be consulted by the responsible person before decisions are made?)
- Information (Who must be informed of decisions, once made?)
Ensure this information is easily accessible and use it to inform who does what and who is looped into discussions and kept up to date.
RAACI #roles and responsibility #teamwork #project management Clarifying roles and responsibilities, levels of autonomy/latitude in decision making, and levels of engagement among diverse stakeholders.
Problem-solving warm-up activities
All facilitators know that warm-ups and icebreakers are useful for any workshop or group process. Problem-solving workshops are no different.
Use these problem-solving techniques to warm up a group and prepare them for the rest of the process. Activating your group by tapping into some of the top problem-solving skills can be one of the best ways to see great outcomes from your session.
Check-in / Check-out
Solid processes are planned from beginning to end, and the best facilitators know that setting the tone and establishing a safe, open environment can be integral to a successful problem-solving process. Check-in / Check-out is a great way to begin and/or bookend a problem-solving workshop. Checking in to a session emphasizes that everyone will be seen, heard, and expected to contribute.
If you are running a series of meetings, setting a consistent pattern of checking in and checking out can really help your team get into a groove. We recommend this opening-closing activity for small to medium-sized groups though it can work with large groups if they’re disciplined!
Check-in / Check-out #team #opening #closing #hyperisland #remote-friendly Either checking-in or checking-out is a simple way for a team to open or close a process, symbolically and in a collaborative way. Checking-in/out invites each member in a group to be present, seen and heard, and to express a reflection or a feeling. Checking-in emphasizes presence, focus and group commitment; checking-out emphasizes reflection and symbolic closure.
Doodling Together
Thinking creatively and not being afraid to make suggestions are important problem-solving skills for any group or team, and warming up by encouraging these behaviors is a great way to start.
Doodling Together is one of our favorite creative ice breaker games – it’s quick, effective, and fun and can make all following problem-solving steps easier by encouraging a group to collaborate visually. By passing cards and adding additional items as they go, the workshop group gets into a groove of co-creation and idea development that is crucial to finding solutions to problems.
Doodling Together #collaboration #creativity #teamwork #fun #team #visual methods #energiser #icebreaker #remote-friendly Create wild, weird and often funny postcards together & establish a group’s creative confidence.
Show and Tell
You might remember some version of Show and Tell from being a kid in school and it’s a great problem-solving activity to kick off a session.
Asking participants to prepare a little something before a workshop by bringing an object for show and tell can help them warm up before the session has even begun! Games that include a physical object can also help encourage early engagement before moving onto more big-picture thinking.
By asking your participants to tell stories about why they chose to bring a particular item to the group, you can help teams see things from new perspectives and see both differences and similarities in the way they approach a topic. Great groundwork for approaching a problem-solving process as a team!
Show and Tell #gamestorming #action #opening #meeting facilitation Show and Tell taps into the power of metaphors to reveal players’ underlying assumptions and associations around a topic The aim of the game is to get a deeper understanding of stakeholders’ perspectives on anything—a new project, an organizational restructuring, a shift in the company’s vision or team dynamic.
Constellations
Who doesn’t love stars? Constellations is a great warm-up activity for any workshop as it gets people up off their feet, energized, and ready to engage in new ways with established topics. It’s also great for showing existing beliefs, biases, and patterns that can come into play as part of your session.
Using warm-up games that help build trust and connection while also allowing for non-verbal responses can be great for easing people into the problem-solving process and encouraging engagement from everyone in the group. Constellations is great in large spaces that allow for movement and is definitely a practical exercise to allow the group to see patterns that are otherwise invisible.
Constellations #trust #connection #opening #coaching #patterns #system Individuals express their response to a statement or idea by standing closer or further from a central object. Used with teams to reveal system, hidden patterns, perspectives.
Draw a Tree
Problem-solving games that help raise group awareness through a central, unifying metaphor can be effective ways to warm-up a group in any problem-solving model.
Draw a Tree is a simple warm-up activity you can use in any group and which can provide a quick jolt of energy. Start by asking your participants to draw a tree in just 45 seconds – they can choose whether it will be abstract or realistic.
Once the timer is up, ask the group how many people included the roots of the tree and use this as a means to discuss how we can ignore important parts of any system simply because they are not visible.
All problem-solving strategies are made more effective by thinking of problems critically and by exposing things that may not normally come to light. Warm-up games like Draw a Tree are great in that they quickly demonstrate some key problem-solving skills in an accessible and effective way.
Draw a Tree #thiagi #opening #perspectives #remote-friendly With this game you can raise awarness about being more mindful, and aware of the environment we live in.
Closing activities for a problem-solving process
Each step of the problem-solving workshop benefits from an intelligent deployment of activities, games, and techniques. Bringing your session to an effective close helps ensure that solutions are followed through on and that you also celebrate what has been achieved.
Here are some problem-solving activities you can use to effectively close a workshop or meeting and ensure the great work you’ve done can continue afterward.
One Breath Feedback
Maintaining attention and focus during the closing stages of a problem-solving workshop can be tricky and so being concise when giving feedback can be important. It’s easy to incur “death by feedback” should some team members go on for too long sharing their perspectives in a quick feedback round.
One Breath Feedback is a great closing activity for workshops. You give everyone an opportunity to provide feedback on what they’ve done but only in the space of a single breath. This keeps feedback short and to the point and means that everyone is encouraged to provide the most important piece of feedback to them.
One breath feedback #closing #feedback #action This is a feedback round in just one breath that excels in maintaining attention: each participants is able to speak during just one breath … for most people that’s around 20 to 25 seconds … unless of course you’ve been a deep sea diver in which case you’ll be able to do it for longer.
Who What When Matrix
Matrices feature as part of many effective problem-solving strategies and with good reason. They are easily recognizable, simple to use, and generate results.
The Who What When Matrix is a great tool to use when closing your problem-solving session by attributing a who, what and when to the actions and solutions you have decided upon. The resulting matrix is a simple, easy-to-follow way of ensuring your team can move forward.
Great solutions can’t be enacted without action and ownership. Your problem-solving process should include a stage for allocating tasks to individuals or teams and creating a realistic timeframe for those solutions to be implemented or checked out. Use this method to keep the solution implementation process clear and simple for all involved.
Who/What/When Matrix #gamestorming #action #project planning With Who/What/When matrix, you can connect people with clear actions they have defined and have committed to.
Response cards
Group discussion can comprise the bulk of most problem-solving activities and by the end of the process, you might find that your team is talked out!
Providing a means for your team to give feedback with short written notes can ensure everyone is head and can contribute without the need to stand up and talk. Depending on the needs of the group, giving an alternative can help ensure everyone can contribute to your problem-solving model in the way that makes the most sense for them.
Response Cards is a great way to close a workshop if you are looking for a gentle warm-down and want to get some swift discussion around some of the feedback that is raised.
Response Cards #debriefing #closing #structured sharing #questions and answers #thiagi #action It can be hard to involve everyone during a closing of a session. Some might stay in the background or get unheard because of louder participants. However, with the use of Response Cards, everyone will be involved in providing feedback or clarify questions at the end of a session.
Tips for effective problem solving
Problem-solving activities are only one part of the puzzle. While a great method can help unlock your team’s ability to solve problems, without a thoughtful approach and strong facilitation the solutions may not be fit for purpose.
Let’s take a look at some problem-solving tips you can apply to any process to help it be a success!
Clearly define the problem
Jumping straight to solutions can be tempting, though without first clearly articulating a problem, the solution might not be the right one. Many of the problem-solving activities below include sections where the problem is explored and clearly defined before moving on.
This is a vital part of the problem-solving process and taking the time to fully define an issue can save time and effort later. A clear definition helps identify irrelevant information and it also ensures that your team sets off on the right track.
Don’t jump to conclusions
It’s easy for groups to exhibit cognitive bias or have preconceived ideas about both problems and potential solutions. Be sure to back up any problem statements or potential solutions with facts, research, and adequate forethought.
The best techniques ask participants to be methodical and challenge preconceived notions. Make sure you give the group enough time and space to collect relevant information and consider the problem in a new way. By approaching the process with a clear, rational mindset, you’ll often find that better solutions are more forthcoming.
Try different approaches
Problems come in all shapes and sizes and so too should the methods you use to solve them. If you find that one approach isn’t yielding results and your team isn’t finding different solutions, try mixing it up. You’ll be surprised at how using a new creative activity can unblock your team and generate great solutions.
Don’t take it personally
Depending on the nature of your team or organizational problems, it’s easy for conversations to get heated. While it’s good for participants to be engaged in the discussions, ensure that emotions don’t run too high and that blame isn’t thrown around while finding solutions.
You’re all in it together, and even if your team or area is seeing problems, that isn’t necessarily a disparagement of you personally. Using facilitation skills to manage group dynamics is one effective method of helping conversations be more constructive.
Get the right people in the room
Your problem-solving method is often only as effective as the group using it. Getting the right people on the job and managing the number of people present is important too!
If the group is too small, you may not get enough different perspectives to effectively solve a problem. If the group is too large, you can go round and round during the ideation stages.
Creating the right group makeup is also important in ensuring you have the necessary expertise and skillset to both identify and follow up on potential solutions. Carefully consider who to include at each stage to help ensure your problem-solving method is followed and positioned for success.
Create psychologically safe spaces for discussion
Identifying a problem accurately also requires that all members of a group are able to contribute their views in an open and safe manner.
It can be tough for people to stand up and contribute if the problems or challenges are emotive or personal in nature. Try and create a psychologically safe space for these kinds of discussions and where possible, create regular opportunities for challenges to be brought up organically.
Document everything
The best solutions can take refinement, iteration, and reflection to come out. Get into a habit of documenting your process in order to keep all the learnings from the session and to allow ideas to mature and develop. Many of the methods below involve the creation of documents or shared resources. Be sure to keep and share these so everyone can benefit from the work done!
Bring a facilitator
Facilitation is all about making group processes easier. With a subject as potentially emotive and important as problem-solving, having an impartial third party in the form of a facilitator can make all the difference in finding great solutions and keeping the process moving. Consider bringing a facilitator to your problem-solving session to get better results and generate meaningful solutions!
Develop your problem-solving skills
It takes time and practice to be an effective problem solver. While some roles or participants might more naturally gravitate towards problem-solving, it can take development and planning to help everyone create better solutions.
You might develop a training program, run a problem-solving workshop or simply ask your team to practice using the techniques below. Check out our post on problem-solving skills to see how you and your group can develop the right mental process and be more resilient to issues too!
Design a great agenda
Workshops are a great format for solving problems. With the right approach, you can focus a group and help them find the solutions to their own problems. But designing a process can be time-consuming and finding the right activities can be difficult.
Check out our workshop planning guide to level-up your agenda design and start running more effective workshops. Need inspiration? Check out templates designed by expert facilitators to help you kickstart your process!
Save time and effort creating an effective problem solving process
A structured problem solving process is a surefire way of solving tough problems, discovering creative solutions and driving organizational change. But how can you design for successful outcomes?
With SessionLab, it’s easy to design engaging workshops that deliver results. Drag, drop and reorder blocks to build your agenda. When you make changes or update your agenda, your session timing adjusts automatically , saving you time on manual adjustments.
Collaborating with stakeholders or clients? Share your agenda with a single click and collaborate in real-time. No more sending documents back and forth over email.
Explore how to use SessionLab to design effective problem solving workshops or watch this five minute video to see the planner in action!
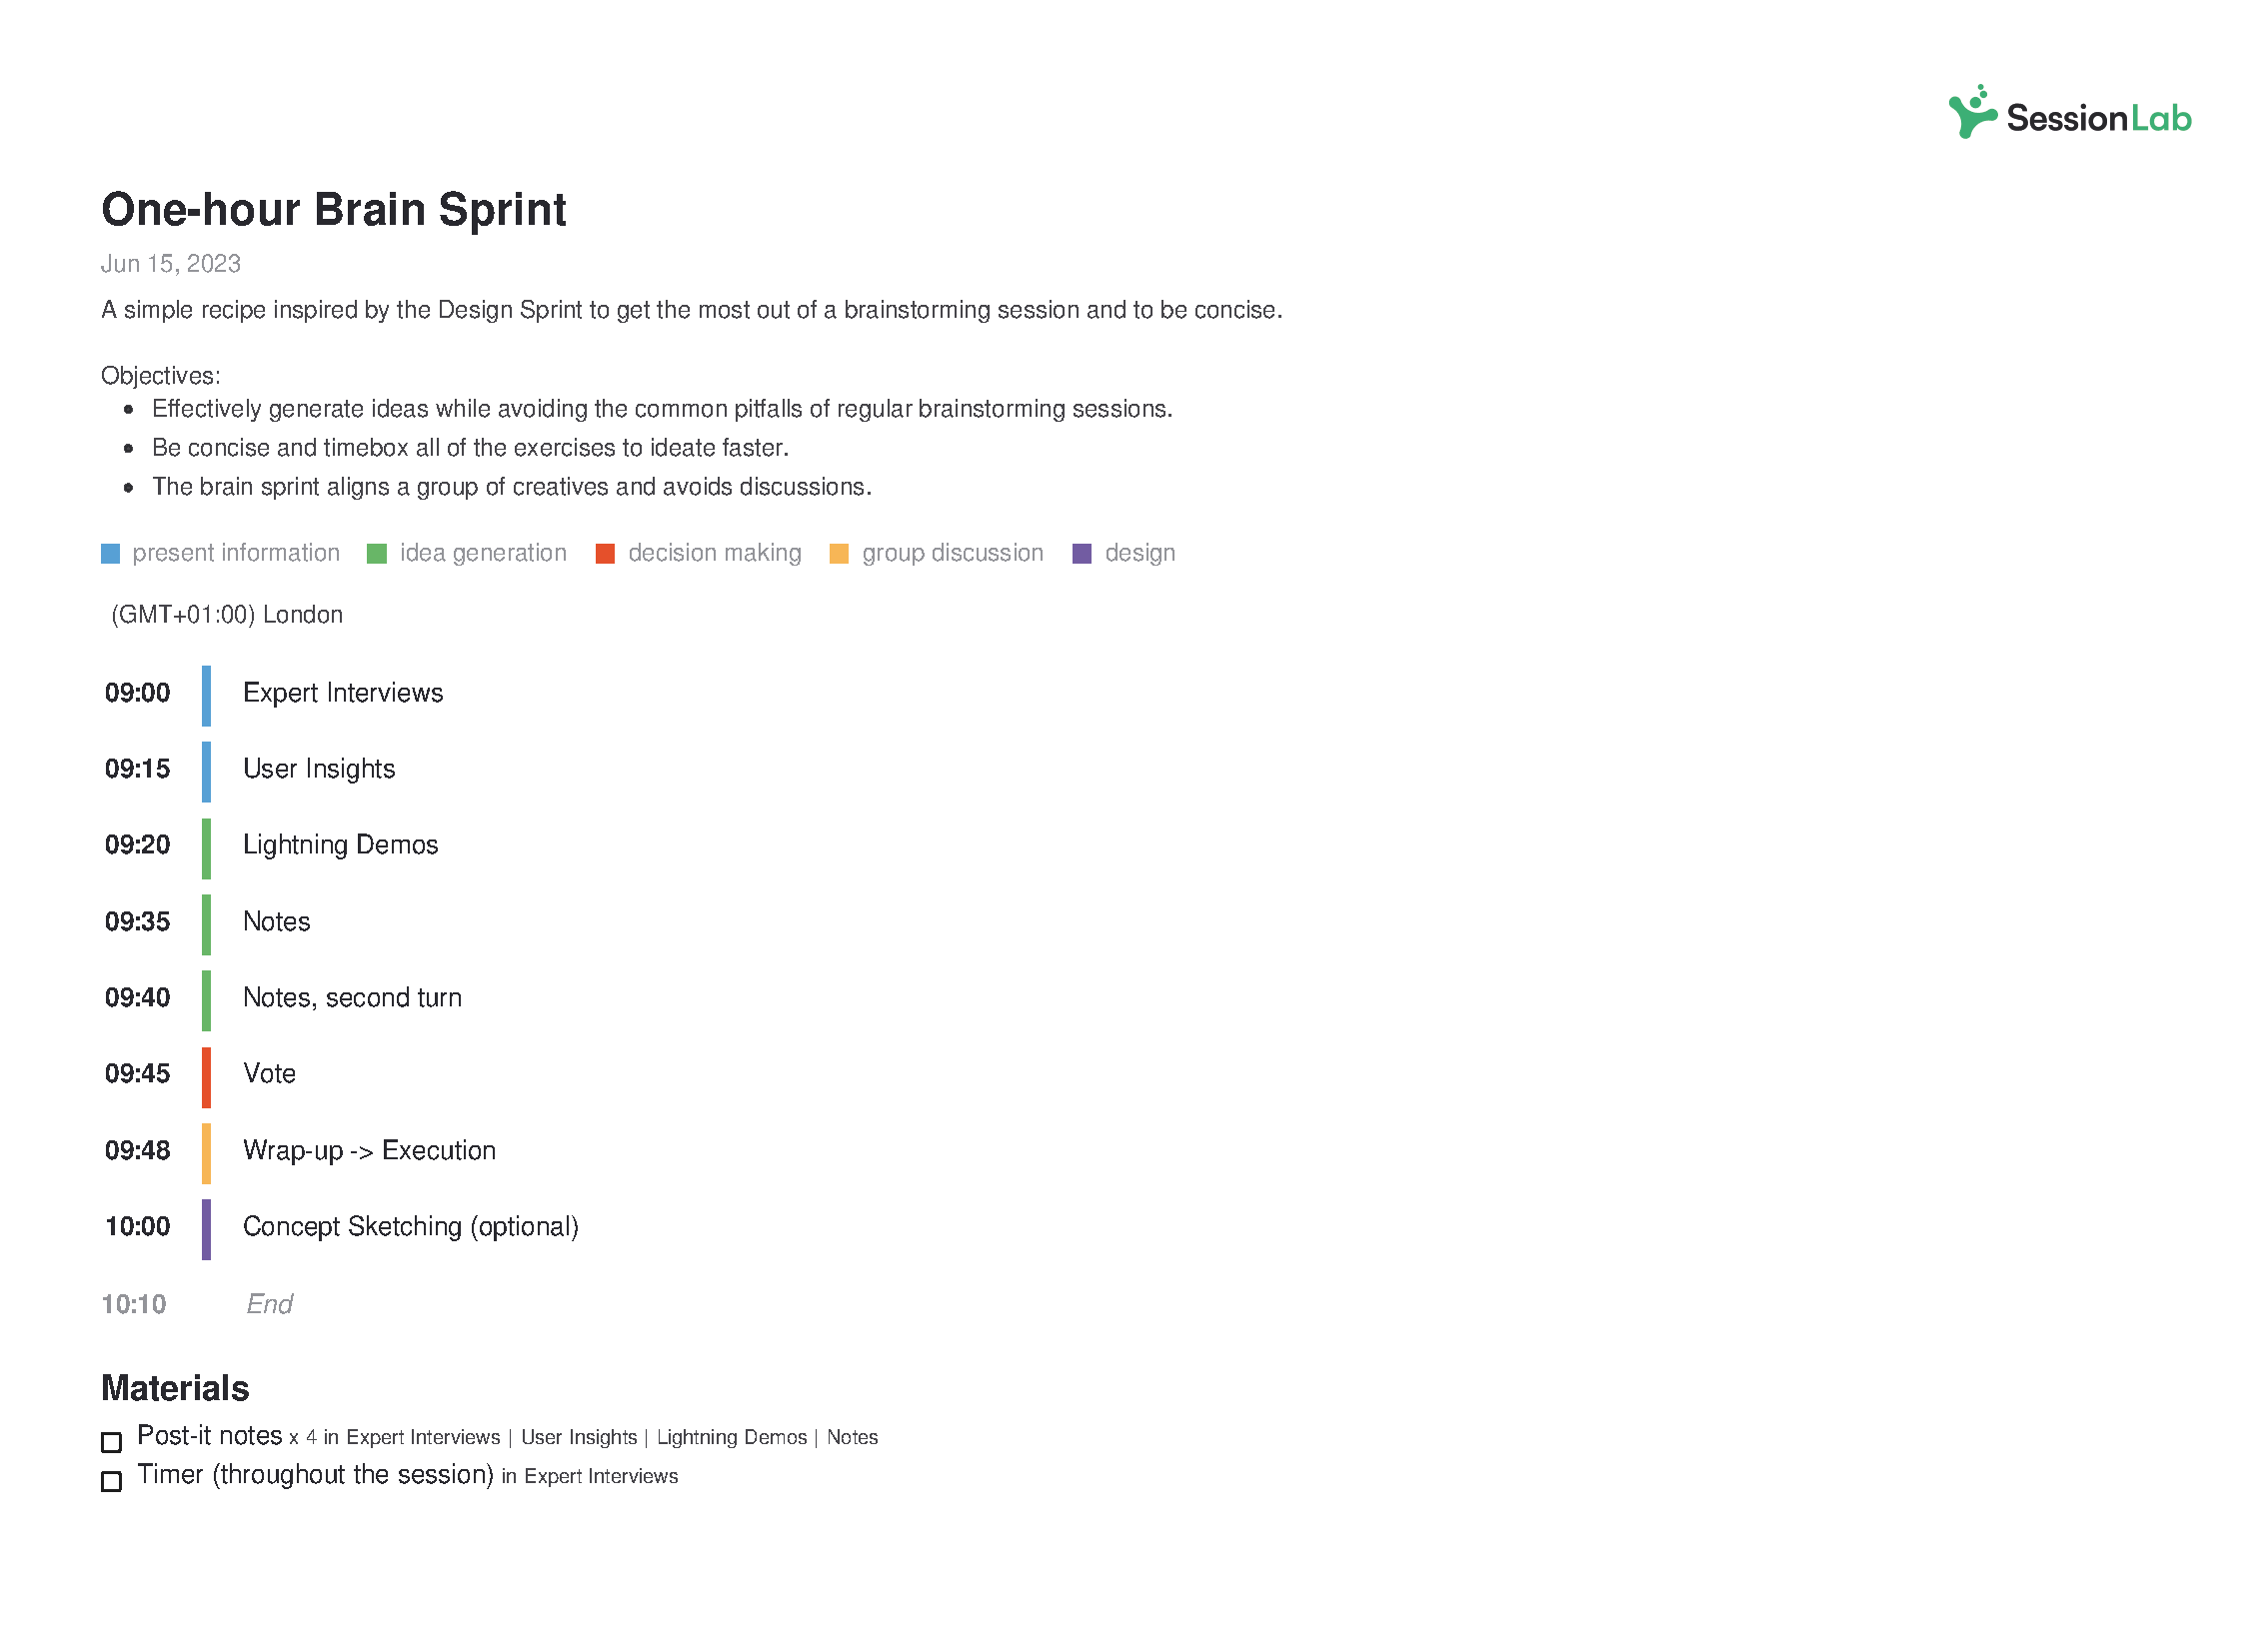
Over to you
The problem-solving process can often be as complicated and multifaceted as the problems they are set-up to solve. With the right problem-solving techniques and a mix of exercises designed to guide discussion and generate purposeful ideas, we hope we’ve given you the tools to find the best solutions as simply and easily as possible.
Is there a problem-solving technique that you are missing here? Do you have a favorite activity or method you use when facilitating? Let us know in the comments below, we’d love to hear from you!

James Smart is Head of Content at SessionLab. He’s also a creative facilitator who has run workshops and designed courses for establishments like the National Centre for Writing, UK. He especially enjoys working with young people and empowering others in their creative practice.

thank you very much for these excellent techniques

Certainly wonderful article, very detailed. Shared!

Your list of techniques for problem solving can be helpfully extended by adding TRIZ to the list of techniques. TRIZ has 40 problem solving techniques derived from methods inventros and patent holders used to get new patents. About 10-12 are general approaches. many organization sponsor classes in TRIZ that are used to solve business problems or general organiztational problems. You can take a look at TRIZ and dwonload a free internet booklet to see if you feel it shound be included per your selection process.
Leave a Comment Cancel reply
Your email address will not be published. Required fields are marked *

Going from a mere idea to a workshop that delivers results for your clients can feel like a daunting task. In this piece, we will shine a light on all the work behind the scenes and help you learn how to plan a workshop from start to finish. On a good day, facilitation can feel like effortless magic, but that is mostly the result of backstage work, foresight, and a lot of careful planning. Read on to learn a step-by-step approach to breaking the process of planning a workshop into small, manageable chunks. The flow starts with the first meeting with a client to define the purposes of a workshop.…

Effective online tools are a necessity for smooth and engaging virtual workshops and meetings. But how do you choose the right ones? Do you sometimes feel that the good old pen and paper or MS Office toolkit and email leaves you struggling to stay on top of managing and delivering your workshop? Fortunately, there are plenty of great workshop tools to make your life easier when you need to facilitate a meeting and lead workshops. In this post, we’ll share our favorite online tools you can use to make your life easier and run better workshops and meetings. In fact, there are plenty of free online workshop tools and meeting…

How does learning work? A clever 9-year-old once told me: “I know I am learning something new when I am surprised.” The science of adult learning tells us that, in order to learn new skills (which, unsurprisingly, is harder for adults to do than kids) grown-ups need to first get into a specific headspace. In a business, this approach is often employed in a training session where employees learn new skills or work on professional development. But how do you ensure your training is effective? In this guide, we'll explore how to create an effective training session plan and run engaging training sessions. As team leader, project manager, or consultant,…
Design your next workshop with SessionLab
Join the 150,000 facilitators using SessionLab
Sign up for free
Join our live webinar on 10/1 to get practical strategies to upgrade your LPA program.
Register now
5 Common Root Cause Analysis Tools for More Effective Problem-Solving

Next to accurately defining a problem, root cause analysis (RCA) is one of the most important elements of problem-solving in quality management. Effective RCA ensures that the actual cause of a problem is identified and addressed, preventing recurrence.
This is where methodologies like Six Sigma, with its DMAIC (Define, Measure, Analyze, Improve, Control) framework, come into play. Six Sigma provides a structured approach that complements RCA tools. It ensures a thorough analysis and sustainable improvement in quality processes.
As you can see, defining the problem is the first step. It’s crucial to identify the right tool for determining the real cause of a problem and prioritizing its solution.
Should you use fault tree analysis, which uses boolean logic, or FMEA, which combines qualitative and quantitative methods? Which is the best root cause analysis tool type for you?
Manufacturers have a range of methods, tools and techniques at their fingertips, each of which is appropriate for different situations. Below, we discuss five common root cause analysis tools:
- Pareto Chart
- Fishbone Diagram
- Scatter Diagram
- Failure Mode and Effects Analysis (FMEA)
Download our free Root Cause Analysis 101 Guidebook
Read 14 quality metrics every executive should know
1. Pareto Chart
A Pareto chart is a histogram or bar chart combined with a line graph that groups the frequency or cost of different problems to show their relative significance. The bars show frequency in descending order, while the line shows cumulative percentage or total as you move from left to right.

The example above is a report from layered process audit software that groups together the top seven categories of failed audit questions for a given facility. Layered process audits (LPAs) allow you to check high-risk processes daily to verify conformance to standards. LPAs identify process variations that cause defects, making Pareto charts a powerful reporting tool for analyzing LPA findings.
These charts are one of the seven basic tools of quality described by quality pioneer Joseph Juran and are based on Pareto’s law, also called the 80/20 rule. This rule says that 20% of inputs drive 80% of results.
Learn how to create Pareto charts in this post or download the Pareto Chart Tip Sheet and Sample Excel File
The 5 Whys is a method that uses a series of questions to drill down into successive layers of a problem. The basic idea is that each time you ask why, the answer becomes the basis of the next why. It’s a simple tool useful for problems where you don’t need advanced statistics, so you don’t necessarily want to use it for complex problems.
One application of this technique is to more deeply analyze the results of a Pareto analysis. Here’s an example of how to use the 5 Whys:
Problem: Final assembly time exceeds the target
- Why is downtime in the final assembly higher than our goal? According to the Pareto chart, the biggest factor is operators needing to constantly adjust Machine A
- Why do operators need to constantly adjust Machine A? Because it keeps having alignment problems
- Why does Machine A keep having alignment problems? Because the seals are worn
- Why are Machine A’s seals worn? Because they aren’t being replaced as part of our preventive maintenance program
- Why aren’t they being replaced as part of our preventive maintenance program? Because seal replacement wasn’t captured in the needs assessment
Of course, it may take asking why more than five times to solve the issue—the point is to peel away surface-level issues to find the root cause of the problem.
Learn more about the 5 Whys method in this blog post or download our free 5 Whys worksheet .
3. Ishikawa Fishbone Diagram
One way to analyze a problem is to draw it out. Being able to see the information organized visually can make it easier to determine the cause and effect of the problem.
A fishbone diagram sorts possible causes into categories that branch off from the original problem. Also called a cause-and-effect or Ishikawa diagram, this tool may have multiple sub-causes branching off each identified category.

The main problem or effect is placed at the “head” of the fish, and the various causes are drawn as “bones” branching off from the main line. These branches are typically grouped into major categories such as People, Methods, Machines, Materials, Measurements, and Environment, though these categories can be customized depending on the specific context.
Each major category can have smaller branches that delve deeper into more specific sub-causes, helping to organize and prioritize potential causes of the problem systematically.
Learn more about how to use a fishbone diagram in this blog post and download our free set of fishbone diagram templates
4. Scatter Plot Diagram
A scatter plot or scatter diagram uses pairs of data points to help uncover relationships between variables. A scatter plot is a quantitative method for determining whether two variables are correlated, such as testing potential causes identified in your fishbone diagram.
Making a scatter diagram is as simple as plotting your independent variable (or suspected cause) on the x-axis, and your dependent variable (the effect) on the y-axis. If the pattern shows a clear line or curve, you know the variables are correlated and you can proceed to regression or correlation analysis.
Download a free tip sheet to start creating your own scatter diagrams today!
5. Failure Mode and Effects Analysis (FMEA)
Failure mode and effects analysis (FMEA) is a method used during product or process design to explore potential defects or failures. An FMEA chart outlines:
- Potential failures, consequences and causes
- Current controls to prevent each type of failure
- Severity (S), occurrence (O) and detection (D) ratings that allow you to calculate a risk priority number (RPN) for determining further action
When applied to process analysis, this method is called process failure mode and effects analysis (PFMEA). Many manufacturers use PFMEA findings to inform questions for process audits , using this problem-solving tool to reduce risk at the source.
No matter which tool you use, root cause analysis is just the beginning of the problem-solving process. Once you know the cause, the next step is implementing a solution and conducting regular checks to ensure you’re holding the gain and achieving sustainable continuous improvement.

Related articles
Advisory boards aren’t only for executives. Join the LogRocket Content Advisory Board today →
- Product Management
- Solve User-Reported Issues
- Find Issues Faster
- Optimize Conversion and Adoption
A guide to problem-solving techniques, steps, and skills

You might associate problem-solving with the math exercises that a seven-year-old would do at school. But problem-solving isn’t just about math — it’s a crucial skill that helps everyone make better decisions in everyday life or work.

Problem-solving involves finding effective solutions to address complex challenges, in any context they may arise.
Unfortunately, structured and systematic problem-solving methods aren’t commonly taught. Instead, when solving a problem, PMs tend to rely heavily on intuition. While for simple issues this might work well, solving a complex problem with a straightforward solution is often ineffective and can even create more problems.
In this article, you’ll learn a framework for approaching problem-solving, alongside how you can improve your problem-solving skills.
The 7 steps to problem-solving
When it comes to problem-solving there are seven key steps that you should follow: define the problem, disaggregate, prioritize problem branches, create an analysis plan, conduct analysis, synthesis, and communication.
1. Define the problem
Problem-solving begins with a clear understanding of the issue at hand. Without a well-defined problem statement, confusion and misunderstandings can hinder progress. It’s crucial to ensure that the problem statement is outcome-focused, specific, measurable whenever possible, and time-bound.
Additionally, aligning the problem definition with relevant stakeholders and decision-makers is essential to ensure efforts are directed towards addressing the actual problem rather than side issues.
2. Disaggregate
Complex issues often require deeper analysis. Instead of tackling the entire problem at once, the next step is to break it down into smaller, more manageable components.
Various types of logic trees (also known as issue trees or decision trees) can be used to break down the problem. At each stage where new branches are created, it’s important for them to be “MECE” – mutually exclusive and collectively exhaustive. This process of breaking down continues until manageable components are identified, allowing for individual examination.
The decomposition of the problem demands looking at the problem from various perspectives. That is why collaboration within a team often yields more valuable results, as diverse viewpoints lead to a richer pool of ideas and solutions.
3. Prioritize problem branches
The next step involves prioritization. Not all branches of the problem tree have the same impact, so it’s important to understand the significance of each and focus attention on the most impactful areas. Prioritizing helps streamline efforts and minimize the time required to solve the problem.

Over 200k developers and product managers use LogRocket to create better digital experiences
4. Create an analysis plan
For prioritized components, you may need to conduct in-depth analysis. Before proceeding, a work plan is created for data gathering and analysis. If work is conducted within a team, having a plan provides guidance on what needs to be achieved, who is responsible for which tasks, and the timelines involved.
5. Conduct analysis
Data gathering and analysis are central to the problem-solving process. It’s a good practice to set time limits for this phase to prevent excessive time spent on perfecting details. You can employ heuristics and rule-of-thumb reasoning to improve efficiency and direct efforts towards the most impactful work.
6. Synthesis
After each individual branch component has been researched, the problem isn’t solved yet. The next step is synthesizing the data logically to address the initial question. The synthesis process and the logical relationship between the individual branch results depend on the logic tree used.
7. Communication
The last step is communicating the story and the solution of the problem to the stakeholders and decision-makers. Clear effective communication is necessary to build trust in the solution and facilitates understanding among all parties involved. It ensures that stakeholders grasp the intricacies of the problem and the proposed solution, leading to informed decision-making.
Exploring problem-solving in various contexts
While problem-solving has traditionally been associated with fields like engineering and science, today it has become a fundamental skill for individuals across all professions. In fact, problem-solving consistently ranks as one of the top skills required by employers.
Problem-solving techniques can be applied in diverse contexts:
- Individuals — What career path should I choose? Where should I live? These are examples of simple and common personal challenges that require effective problem-solving skills
- Organizations — Businesses also face many decisions that are not trivial to answer. Should we expand into new markets this year? How can we enhance the quality of our product development? Will our office accommodate the upcoming year’s growth in terms of capacity?
- Societal issues — The biggest world challenges are also complex problems that can be addressed with the same technique. How can we minimize the impact of climate change? How do we fight cancer?
Despite the variation in domains and contexts, the fundamental approach to solving these questions remains the same. It starts with gaining a clear understanding of the problem, followed by decomposition, conducting analysis of the decomposed branches, and synthesizing it into a result that answers the initial problem.
Real-world examples of problem-solving
Let’s now explore some examples where we can apply the problem solving framework.
Problem: In the production of electronic devices, you observe an increasing number of defects. How can you reduce the error rate and improve the quality?

Before delving into analysis, you can deprioritize branches that you already have information for or ones you deem less important. For instance, while transportation delays may occur, the resulting material degradation is likely negligible. For other branches, additional research and data gathering may be necessary.
Once results are obtained, synthesis is crucial to address the core question: How can you decrease the defect rate?
While all factors listed may play a role, their significance varies. Your task is to prioritize effectively. Through data analysis, you may discover that altering the equipment would bring the most substantial positive outcome. However, executing a solution isn’t always straightforward. In prioritizing, you should consider both the potential impact and the level of effort needed for implementation.
By evaluating impact and effort, you can systematically prioritize areas for improvement, focusing on those with high impact and requiring minimal effort to address. This approach ensures efficient allocation of resources towards improvements that offer the greatest return on investment.
Problem : What should be my next job role?

When breaking down this problem, you need to consider various factors that are important for your future happiness in the role. This includes aspects like the company culture, our interest in the work itself, and the lifestyle that you can afford with the role.
However, not all factors carry the same weight for us. To make sense of the results, we can assign a weight factor to each branch. For instance, passion for the job role may have a weight factor of 1, while interest in the industry may have a weight factor of 0.5, because that is less important for you.
By applying these weights to a specific role and summing the values, you can have an estimate of how suitable that role is for you. Moreover, you can compare two roles and make an informed decision based on these weighted indicators.
Key problem-solving skills
This framework provides the foundation and guidance needed to effectively solve problems. However, successfully applying this framework requires the following:
- Creativity — During the decomposition phase, it’s essential to approach the problem from various perspectives and think outside the box to generate innovative ideas for breaking down the problem tree
- Decision-making — Throughout the process, decisions must be made, even when full confidence is lacking. Employing rules of thumb to simplify analysis or selecting one tree cut over another requires decisiveness and comfort with choices made
- Analytical skills — Analytical and research skills are necessary for the phase following decomposition, involving data gathering and analysis on selected tree branches
- Teamwork — Collaboration and teamwork are crucial when working within a team setting. Solving problems effectively often requires collective effort and shared responsibility
- Communication — Clear and structured communication is essential to convey the problem solution to stakeholders and decision-makers and build trust
How to enhance your problem-solving skills
Problem-solving requires practice and a certain mindset. The more you practice, the easier it becomes. Here are some strategies to enhance your skills:
- Practice structured thinking in your daily life — Break down problems or questions into manageable parts. You don’t need to go through the entire problem-solving process and conduct detailed analysis. When conveying a message, simplify the conversation by breaking the message into smaller, more understandable segments
- Regularly challenging yourself with games and puzzles — Solving puzzles, riddles, or strategy games can boost your problem-solving skills and cognitive agility.
- Engage with individuals from diverse backgrounds and viewpoints — Conversing with people who offer different perspectives provides fresh insights and alternative solutions to problems. This boosts creativity and helps in approaching challenges from new angles
Final thoughts
Problem-solving extends far beyond mathematics or scientific fields; it’s a critical skill for making informed decisions in every area of life and work. The seven-step framework presented here provides a systematic approach to problem-solving, relevant across various domains.
Now, consider this: What’s one question currently on your mind? Grab a piece of paper and try to apply the problem-solving framework. You might uncover fresh insights you hadn’t considered before.
Featured image source: IconScout
LogRocket generates product insights that lead to meaningful action
Get your teams on the same page — try LogRocket today.
Share this:
- Click to share on Twitter (Opens in new window)
- Click to share on Reddit (Opens in new window)
- Click to share on LinkedIn (Opens in new window)
- Click to share on Facebook (Opens in new window)
- #career development
- #tools and resources

Stop guessing about your digital experience with LogRocket
Recent posts:.

How PMs can best work with UX designers
With a well-built collaborative working environment you can successfully deliver customer centric products.

Leader Spotlight: Evaluating data in aggregate, with Christina Trampota
Christina Trampota shares how looking at data in aggregate can help you understand if you are building the right product for your audience.

What is marketing myopia? Definition, causes, and solutions
Combat marketing myopia by observing market trends and by allocating sufficient resources to research, development, and marketing.

Leader Spotlight: How features evolve from wants to necessities, with David LoPresti
David LoPresti, Director, U-Haul Apps at U-Haul, talks about how certain product features have evolved from wants to needs.
Leave a Reply Cancel reply
- Join Mind Tools

Root Cause Analysis
Tracing a problem to its origins.
In medicine, it's easy to understand the difference between treating the symptoms and curing the condition. A broken wrist, for example, really hurts! But painkillers will only take away the symptoms; you'll need a different treatment to help your bones heal properly.
But what do you do when you have a problem at work? Do you jump straight in and treat the symptoms, or do you stop to consider whether there's actually a deeper problem that needs your attention? If you only fix the symptoms – what you see on the surface – the problem will almost certainly return, and need fixing over and over again.
However, if you look deeper to figure out what's causing the problem, you can fix the underlying systems and processes so that it goes away for good.
What Is Root Cause Analysis?
Root Cause Analysis (RCA) is a popular and often-used technique that helps people answer the question of why the problem occurred in the first place. It seeks to identify the origin of a problem using a specific set of steps, with associated tools, to find the primary cause of the problem, so that you can:
- Determine what happened.
- Determine why it happened.
- Figure out what to do to reduce the likelihood that it will happen again.
RCA assumes that systems and events are interrelated. An action in one area triggers an action in another, and another, and so on. By tracing back these actions, you can discover where the problem started and how it grew into the symptom you're now facing.
You'll usually find three basic types of cause:
- Physical causes – Tangible, material items failed in some way (for example, a car's brakes stopped working).
- Human causes – People did something wrong, or did not do something that was needed. Human causes typically lead to physical causes (for example, no one filled the brake fluid, which led to the brakes failing).
- Organizational causes – A system, process, or policy that people use to make decisions or do their work is faulty (for example, no one person was responsible for vehicle maintenance, and everyone assumed someone else had filled the brake fluid).
RCA looks at all three types of causes. It involves investigating the patterns of negative effects, finding hidden flaws in the system, and discovering specific actions that contributed to the problem. This often means that RCA reveals more than one root cause.
You can apply RCA to almost any situation. Determining how far to go in your investigation requires good judgment and common sense. Theoretically, you could continue to trace the root causes back to the Stone Age, but the effort would serve no useful purpose. Be careful to understand when you've found a significant cause that can, in fact, be changed.
To learn more about Root Cause Analysis, watch this video .
The Root Cause Analysis Process
RCA has five identifiable steps.
Step One: Define the Problem
- What do you see happening?
- What are the specific symptoms?
Step Two: Collect Data
- What proof do you have that the problem exists?
- How long has the problem existed?
- What is the impact of the problem?
You need to analyze a situation fully before you can move on to look at factors that contributed to the problem. To maximize the effectiveness of your RCA, get together everyone – experts and front line staff – who understands the situation. People who are most familiar with the problem can help lead you to a better understanding of the issues.
Finding This Article Useful?
You can learn another 44 problem-solving skills, like this, by joining the Mind Tools Club.

Subscribe to Our Newsletter
Receive new career skills every week, plus get our latest offers and a free downloadable Personal Development Plan workbook.
A helpful tool at this stage is CATWOE . With this process, you look at the same situation from different perspectives: the Customers, the people (Actors) who implement the solutions, the Transformation process that's affected, the World view, the process Owner, and Environmental constraints.
Step Three: Identify Possible Causal Factors
- What sequence of events leads to the problem?
- What conditions allow the problem to occur?
- What other problems surround the occurrence of the central problem?
During this stage, identify as many causal factors as possible. Too often, people identify one or two factors and then stop, but that's not sufficient. With RCA, you don't want to simply treat the most obvious causes – you want to dig deeper.
Use these tools to help identify causal factors:
- Appreciation – Use the facts and ask "So what?" to determine all the possible consequences of a fact.
- 5 Whys – Ask "Why?" until you get to the root of the problem.
- Drill Down – Break down a problem into small, detailed parts to better understand the big picture.
- Cause and Effect Diagrams – Create a chart of all of the possible causal factors, to see where the trouble may have begun.
Step Four: Identify the Root Cause(s)
- Why does the causal factor exist?
- What is the real reason the problem occurred?
Use the same tools you used to identify the causal factors (in Step Three) to look at the roots of each factor. These tools are designed to encourage you to dig deeper at each level of cause and effect.
Step Five: Recommend and Implement Solutions
- What can you do to prevent the problem from happening again?
- How will the solution be implemented?
- Who will be responsible for it?
- What are the risks of implementing the solution?
Analyze your cause-and-effect process, and identify the changes needed for various systems. It's also important that you plan ahead to predict the effects of your solution. This way, you can spot potential failures before they happen.
One way of doing this is to use Failure Mode and Effects Analysis (FMEA). This tool builds on the idea of risk analysis to identify points where a solution could fail. FMEA is also a great system to implement across your organization; the more systems and processes that use FMEA at the start, the less likely you are to have problems that need RCA in the future.
Impact Analysis is another useful tool here. This helps you explore possible positive and negative consequences of a change on different parts of a system or organization.
Another great strategy to adopt is Kaizen , or continuous improvement. This is the idea that continual small changes create better systems overall. Kaizen also emphasizes that the people closest to a process should identify places for improvement. Again, with Kaizen alive and well in your company, the root causes of problems can be identified and resolved quickly and effectively.
Root Cause Analysis is a useful process for understanding and solving a problem.
Figure out what negative events are occurring. Then, look at the complex systems around those problems, and identify key points of failure. Finally, determine solutions to address those key points, or root causes.
You can use many tools to support your RCA process. Cause and Effect Diagrams and 5 Whys are integral to the process itself, while FMEA and Kaizen help minimize the need for RCA in the future.
As an analytical tool, RCA is an essential way to perform a comprehensive, system-wide review of significant problems as well as the events and factors leading to them.
Click on the button below to download a template that will help you log problems, likely root causes and potential solutions. Thanks to Mind Tools Club member weeze for providing the basis for this.
Download Worksheet
This site teaches you the skills you need for a happy and successful career; and this is just one of many tools and resources that you'll find here at Mind Tools. Subscribe to our free newsletter , or join the Mind Tools Club and really supercharge your career!
Rate this resource
The Mind Tools Club gives you exclusive tips and tools to boost your career - plus a friendly community and support from our career coaches!

Comments (58)
- Over a month ago Michele wrote Hi Kwasi, You are most welcome. Completing a root cause analysis ensures that you identify the core issue to any problem. Michele Mind Tools Team
- Over a month ago Kwasi wrote This is a good start for my career. As it provides profound details of training for a successful career. Thanks for the opportunity.
- Over a month ago minhserge wrote The content of this article is very more so it 's not easy to follow well
Please wait...
- Engineering
The Partner of Choice for Engineers Across the Globe

SOLUTION TOPICS
Quality engineering, process engineering, chemical engineering, biomedical engineering, electrical engineering, reliability engineering, mechanical engineering, solutions built for engineers.
Minitab provides a multitude of solutions for engineers to aid in problem solving and analytics. Attack problems with brainstorming tools, plan projects and process improvements through visual tools, and then collect data and analyze it, all within the Minitab ecosystem. Our solutions can help you find the answers you need using graphical tools, statistics, and predictive analytics.

For quality professionals, it is crucial to quickly and clearly identify the root cause when customers are experiencing problems with services or products. Minitab is the ideal partner for quality professionals who want to take on additional projects, or lead the development of a formal continuous improvement or operational excellence program.

Watch the webinar to explore a step-by-step project roadmap to effectively investigate, improve, and maintain a process.
Process engineers need to understand their processes. Minitab is the expert in process improvement, with solutions designed to identify areas of improvement, measure processes outcomes, and monitor them. See an example of how Minitab can help with capability statistics that tell you how well your process is meeting the specifications that you have.

Statistics plays a big role in all engineering professions and has become even more important for chemical engineers. Because of the proliferation of inexpensive instrumentation, an engineer working in a modern plant has access to a tremendous amount of data. As a result, chemical engineers are dealing with more, and more complex, data than ever before. Learning data analysis and data science skills will enable you to provide unique and in-depth insights from your data that can create significant value for your organization today.

Applying the principles of biology, medicine, and engineering create life-saving solutions. That’s why Minitab works closely with biomedical engineers to ensure they are creating the safest and highest quality products. Learn how Boston Scientific leveraged Minitab solutions to improve manufacturing and as a result, drove significant savings.

Minitab provides solutions to enable electrical engineers to design, develop, test, and supervise the manufacture of electrical equipment. With different analytical and problem-solving tools, Minitab is the partner of choice for electrical engineers. Learn more about how one electronics maker used one of Minitab’s tools to find better specifications for suppliers and realize significant cost savings.

Imagine your new car breaks down after driving 60 miles. The engine light turns on and your vehicle must now be towed to be serviced. This is not only a warranty issue but also a field problem, due to lack of product reliability. Minitab partners with engineers to both optimize the design of products and ensure reliability to prevent this happening to you.

Mechanical engineers work on a wide range of projects from creating detailed designs to conducting simulations and analyses. Mechanical engineers must not only collaborate with multidisciplinary teams to ensure projects are completed successfully and on schedule, but they also play a key role in troubleshooting and resolving technical issues, conducting research, and improving mechanical systems and devices. Minitab provides mechanical engineers the broadest solutions and resources needed to perform their duties better, faster and easier.

The Partner of Choice for Engineers Around the Globe
When there is a problem, engineers are tasked to solve it. As if that isn’t challenging enough, working without proper tools and solutions makes problem-solving more difficult. To truly be successful, engineers need access to data, solutions to integrate and analyze it, project management skills, and templates to improve the process and ensure continuous improvement.
That’s why Minitab created an ecosystem that tackles problem-solving the way engineers do. Need structured problem-solving tools to brainstorm? Check! Want to standardize forms like FMEAs, PPAP, or House of Quality? We have them! Looking to pull data from different sources to analyze on one platform? You’ve come to the right place!
Whether you’re an engineer in quality or process improvement, or in product development, we understand the day-to-day challenges of properly designing and testing. That’s because we’ve been doing it for over 50 years. We provide solutions to collect, monitor, and measure data with an eye toward improvement. Plus, with our services, training, and education, we can help you do your job better and even expand your skillset. We can help solve your problems, so that you can solve them for your organization.
OUR CUSTOMERS
“Minitab [is] the best tool for quality management. I use Minitab to run time series plots, charts, and control charts, as well as Pareto charts, fish bone charts…all the quality data was presented to upper management using Minitab. I would recommend it without hesitation!”
Jose Luis P. Quality Chief
“I deal with a few projects at a time and Minitab really helps me in understanding the failure points and relations within sub activities of a process. I can do a better root cause analysis to find the origin of a problem and also use the FMEA tool to weigh the severity, occurrence, and detection. I can tell with confidence that we have saved a whole lot of time compared to the hours of discussions and calculations we would have spent if we didn't invest in this software. The efficiency of our team has gone up significantly.”
Rahul V. Senior Development Engineer

“Minitab has made it so easy to analyze [my] data... from creating graphs, statistical analysis, and forming reports, it is the best thing an engineer can ask for. You don't need to be an expert to use it.”
Maria M. Industrial & Manufacturing Engineer
- Trust Center
© 2024 Minitab, LLC. All Rights Reserved.
- Terms of Use
- Privacy Notice
- Cookie Settings
You are now leaving minitab.com.
Click Continue to proceed to:

The 7 Most Useful Data Analysis Methods and Techniques
Data analytics is the process of analyzing raw data to draw out meaningful insights. These insights are then used to determine the best course of action.
When is the best time to roll out that marketing campaign? Is the current team structure as effective as it could be? Which customer segments are most likely to purchase your new product?
Ultimately, data analytics is a crucial driver of any successful business strategy. But how do data analysts actually turn raw data into something useful? There are a range of methods and techniques that data analysts use depending on the type of data in question and the kinds of insights they want to uncover.
You can get a hands-on introduction to data analytics in this free short course .
In this post, we’ll explore some of the most useful data analysis techniques. By the end, you’ll have a much clearer idea of how you can transform meaningless data into business intelligence. We’ll cover:
- What is data analysis and why is it important?
- What is the difference between qualitative and quantitative data?
- Regression analysis
- Monte Carlo simulation
- Factor analysis
- Cohort analysis
- Cluster analysis
- Time series analysis
- Sentiment analysis
- The data analysis process
- The best tools for data analysis
- Key takeaways
The first six methods listed are used for quantitative data , while the last technique applies to qualitative data. We briefly explain the difference between quantitative and qualitative data in section two, but if you want to skip straight to a particular analysis technique, just use the clickable menu.
1. What is data analysis and why is it important?
Data analysis is, put simply, the process of discovering useful information by evaluating data. This is done through a process of inspecting, cleaning, transforming, and modeling data using analytical and statistical tools, which we will explore in detail further along in this article.
Why is data analysis important? Analyzing data effectively helps organizations make business decisions. Nowadays, data is collected by businesses constantly: through surveys, online tracking, online marketing analytics, collected subscription and registration data (think newsletters), social media monitoring, among other methods.
These data will appear as different structures, including—but not limited to—the following:
The concept of big data —data that is so large, fast, or complex, that it is difficult or impossible to process using traditional methods—gained momentum in the early 2000s. Then, Doug Laney, an industry analyst, articulated what is now known as the mainstream definition of big data as the three Vs: volume, velocity, and variety.
- Volume: As mentioned earlier, organizations are collecting data constantly. In the not-too-distant past it would have been a real issue to store, but nowadays storage is cheap and takes up little space.
- Velocity: Received data needs to be handled in a timely manner. With the growth of the Internet of Things, this can mean these data are coming in constantly, and at an unprecedented speed.
- Variety: The data being collected and stored by organizations comes in many forms, ranging from structured data—that is, more traditional, numerical data—to unstructured data—think emails, videos, audio, and so on. We’ll cover structured and unstructured data a little further on.
This is a form of data that provides information about other data, such as an image. In everyday life you’ll find this by, for example, right-clicking on a file in a folder and selecting “Get Info”, which will show you information such as file size and kind, date of creation, and so on.
Real-time data
This is data that is presented as soon as it is acquired. A good example of this is a stock market ticket, which provides information on the most-active stocks in real time.
Machine data
This is data that is produced wholly by machines, without human instruction. An example of this could be call logs automatically generated by your smartphone.
Quantitative and qualitative data
Quantitative data—otherwise known as structured data— may appear as a “traditional” database—that is, with rows and columns. Qualitative data—otherwise known as unstructured data—are the other types of data that don’t fit into rows and columns, which can include text, images, videos and more. We’ll discuss this further in the next section.
2. What is the difference between quantitative and qualitative data?
How you analyze your data depends on the type of data you’re dealing with— quantitative or qualitative . So what’s the difference?
Quantitative data is anything measurable , comprising specific quantities and numbers. Some examples of quantitative data include sales figures, email click-through rates, number of website visitors, and percentage revenue increase. Quantitative data analysis techniques focus on the statistical, mathematical, or numerical analysis of (usually large) datasets. This includes the manipulation of statistical data using computational techniques and algorithms. Quantitative analysis techniques are often used to explain certain phenomena or to make predictions.
Qualitative data cannot be measured objectively , and is therefore open to more subjective interpretation. Some examples of qualitative data include comments left in response to a survey question, things people have said during interviews, tweets and other social media posts, and the text included in product reviews. With qualitative data analysis, the focus is on making sense of unstructured data (such as written text, or transcripts of spoken conversations). Often, qualitative analysis will organize the data into themes—a process which, fortunately, can be automated.
Data analysts work with both quantitative and qualitative data , so it’s important to be familiar with a variety of analysis methods. Let’s take a look at some of the most useful techniques now.
3. Data analysis techniques
Now we’re familiar with some of the different types of data, let’s focus on the topic at hand: different methods for analyzing data.
a. Regression analysis
Regression analysis is used to estimate the relationship between a set of variables. When conducting any type of regression analysis , you’re looking to see if there’s a correlation between a dependent variable (that’s the variable or outcome you want to measure or predict) and any number of independent variables (factors which may have an impact on the dependent variable). The aim of regression analysis is to estimate how one or more variables might impact the dependent variable, in order to identify trends and patterns. This is especially useful for making predictions and forecasting future trends.
Let’s imagine you work for an ecommerce company and you want to examine the relationship between: (a) how much money is spent on social media marketing, and (b) sales revenue. In this case, sales revenue is your dependent variable—it’s the factor you’re most interested in predicting and boosting. Social media spend is your independent variable; you want to determine whether or not it has an impact on sales and, ultimately, whether it’s worth increasing, decreasing, or keeping the same. Using regression analysis, you’d be able to see if there’s a relationship between the two variables. A positive correlation would imply that the more you spend on social media marketing, the more sales revenue you make. No correlation at all might suggest that social media marketing has no bearing on your sales. Understanding the relationship between these two variables would help you to make informed decisions about the social media budget going forward. However: It’s important to note that, on their own, regressions can only be used to determine whether or not there is a relationship between a set of variables—they don’t tell you anything about cause and effect. So, while a positive correlation between social media spend and sales revenue may suggest that one impacts the other, it’s impossible to draw definitive conclusions based on this analysis alone.
There are many different types of regression analysis, and the model you use depends on the type of data you have for the dependent variable. For example, your dependent variable might be continuous (i.e. something that can be measured on a continuous scale, such as sales revenue in USD), in which case you’d use a different type of regression analysis than if your dependent variable was categorical in nature (i.e. comprising values that can be categorised into a number of distinct groups based on a certain characteristic, such as customer location by continent). You can learn more about different types of dependent variables and how to choose the right regression analysis in this guide .
Regression analysis in action: Investigating the relationship between clothing brand Benetton’s advertising expenditure and sales
b. Monte Carlo simulation
When making decisions or taking certain actions, there are a range of different possible outcomes. If you take the bus, you might get stuck in traffic. If you walk, you might get caught in the rain or bump into your chatty neighbor, potentially delaying your journey. In everyday life, we tend to briefly weigh up the pros and cons before deciding which action to take; however, when the stakes are high, it’s essential to calculate, as thoroughly and accurately as possible, all the potential risks and rewards.
Monte Carlo simulation, otherwise known as the Monte Carlo method, is a computerized technique used to generate models of possible outcomes and their probability distributions. It essentially considers a range of possible outcomes and then calculates how likely it is that each particular outcome will be realized. The Monte Carlo method is used by data analysts to conduct advanced risk analysis, allowing them to better forecast what might happen in the future and make decisions accordingly.
So how does Monte Carlo simulation work, and what can it tell us? To run a Monte Carlo simulation, you’ll start with a mathematical model of your data—such as a spreadsheet. Within your spreadsheet, you’ll have one or several outputs that you’re interested in; profit, for example, or number of sales. You’ll also have a number of inputs; these are variables that may impact your output variable. If you’re looking at profit, relevant inputs might include the number of sales, total marketing spend, and employee salaries. If you knew the exact, definitive values of all your input variables, you’d quite easily be able to calculate what profit you’d be left with at the end. However, when these values are uncertain, a Monte Carlo simulation enables you to calculate all the possible options and their probabilities. What will your profit be if you make 100,000 sales and hire five new employees on a salary of $50,000 each? What is the likelihood of this outcome? What will your profit be if you only make 12,000 sales and hire five new employees? And so on. It does this by replacing all uncertain values with functions which generate random samples from distributions determined by you, and then running a series of calculations and recalculations to produce models of all the possible outcomes and their probability distributions. The Monte Carlo method is one of the most popular techniques for calculating the effect of unpredictable variables on a specific output variable, making it ideal for risk analysis.
Monte Carlo simulation in action: A case study using Monte Carlo simulation for risk analysis
c. Factor analysis
Factor analysis is a technique used to reduce a large number of variables to a smaller number of factors. It works on the basis that multiple separate, observable variables correlate with each other because they are all associated with an underlying construct. This is useful not only because it condenses large datasets into smaller, more manageable samples, but also because it helps to uncover hidden patterns. This allows you to explore concepts that cannot be easily measured or observed—such as wealth, happiness, fitness, or, for a more business-relevant example, customer loyalty and satisfaction.
Let’s imagine you want to get to know your customers better, so you send out a rather long survey comprising one hundred questions. Some of the questions relate to how they feel about your company and product; for example, “Would you recommend us to a friend?” and “How would you rate the overall customer experience?” Other questions ask things like “What is your yearly household income?” and “How much are you willing to spend on skincare each month?”
Once your survey has been sent out and completed by lots of customers, you end up with a large dataset that essentially tells you one hundred different things about each customer (assuming each customer gives one hundred responses). Instead of looking at each of these responses (or variables) individually, you can use factor analysis to group them into factors that belong together—in other words, to relate them to a single underlying construct. In this example, factor analysis works by finding survey items that are strongly correlated. This is known as covariance . So, if there’s a strong positive correlation between household income and how much they’re willing to spend on skincare each month (i.e. as one increases, so does the other), these items may be grouped together. Together with other variables (survey responses), you may find that they can be reduced to a single factor such as “consumer purchasing power”. Likewise, if a customer experience rating of 10/10 correlates strongly with “yes” responses regarding how likely they are to recommend your product to a friend, these items may be reduced to a single factor such as “customer satisfaction”.
In the end, you have a smaller number of factors rather than hundreds of individual variables. These factors are then taken forward for further analysis, allowing you to learn more about your customers (or any other area you’re interested in exploring).
Factor analysis in action: Using factor analysis to explore customer behavior patterns in Tehran
d. Cohort analysis
Cohort analysis is a data analytics technique that groups users based on a shared characteristic , such as the date they signed up for a service or the product they purchased. Once users are grouped into cohorts, analysts can track their behavior over time to identify trends and patterns.
So what does this mean and why is it useful? Let’s break down the above definition further. A cohort is a group of people who share a common characteristic (or action) during a given time period. Students who enrolled at university in 2020 may be referred to as the 2020 cohort. Customers who purchased something from your online store via the app in the month of December may also be considered a cohort.
With cohort analysis, you’re dividing your customers or users into groups and looking at how these groups behave over time. So, rather than looking at a single, isolated snapshot of all your customers at a given moment in time (with each customer at a different point in their journey), you’re examining your customers’ behavior in the context of the customer lifecycle. As a result, you can start to identify patterns of behavior at various points in the customer journey—say, from their first ever visit to your website, through to email newsletter sign-up, to their first purchase, and so on. As such, cohort analysis is dynamic, allowing you to uncover valuable insights about the customer lifecycle.
This is useful because it allows companies to tailor their service to specific customer segments (or cohorts). Let’s imagine you run a 50% discount campaign in order to attract potential new customers to your website. Once you’ve attracted a group of new customers (a cohort), you’ll want to track whether they actually buy anything and, if they do, whether or not (and how frequently) they make a repeat purchase. With these insights, you’ll start to gain a much better understanding of when this particular cohort might benefit from another discount offer or retargeting ads on social media, for example. Ultimately, cohort analysis allows companies to optimize their service offerings (and marketing) to provide a more targeted, personalized experience. You can learn more about how to run cohort analysis using Google Analytics .
Cohort analysis in action: How Ticketmaster used cohort analysis to boost revenue
e. Cluster analysis
Cluster analysis is an exploratory technique that seeks to identify structures within a dataset. The goal of cluster analysis is to sort different data points into groups (or clusters) that are internally homogeneous and externally heterogeneous. This means that data points within a cluster are similar to each other, and dissimilar to data points in another cluster. Clustering is used to gain insight into how data is distributed in a given dataset, or as a preprocessing step for other algorithms.
There are many real-world applications of cluster analysis. In marketing, cluster analysis is commonly used to group a large customer base into distinct segments, allowing for a more targeted approach to advertising and communication. Insurance firms might use cluster analysis to investigate why certain locations are associated with a high number of insurance claims. Another common application is in geology, where experts will use cluster analysis to evaluate which cities are at greatest risk of earthquakes (and thus try to mitigate the risk with protective measures).
It’s important to note that, while cluster analysis may reveal structures within your data, it won’t explain why those structures exist. With that in mind, cluster analysis is a useful starting point for understanding your data and informing further analysis. Clustering algorithms are also used in machine learning—you can learn more about clustering in machine learning in our guide .
Cluster analysis in action: Using cluster analysis for customer segmentation—a telecoms case study example
f. Time series analysis
Time series analysis is a statistical technique used to identify trends and cycles over time. Time series data is a sequence of data points which measure the same variable at different points in time (for example, weekly sales figures or monthly email sign-ups). By looking at time-related trends, analysts are able to forecast how the variable of interest may fluctuate in the future.
When conducting time series analysis, the main patterns you’ll be looking out for in your data are:
- Trends: Stable, linear increases or decreases over an extended time period.
- Seasonality: Predictable fluctuations in the data due to seasonal factors over a short period of time. For example, you might see a peak in swimwear sales in summer around the same time every year.
- Cyclic patterns: Unpredictable cycles where the data fluctuates. Cyclical trends are not due to seasonality, but rather, may occur as a result of economic or industry-related conditions.
As you can imagine, the ability to make informed predictions about the future has immense value for business. Time series analysis and forecasting is used across a variety of industries, most commonly for stock market analysis, economic forecasting, and sales forecasting. There are different types of time series models depending on the data you’re using and the outcomes you want to predict. These models are typically classified into three broad types: the autoregressive (AR) models, the integrated (I) models, and the moving average (MA) models. For an in-depth look at time series analysis, refer to our guide .
Time series analysis in action: Developing a time series model to predict jute yarn demand in Bangladesh
g. Sentiment analysis
When you think of data, your mind probably automatically goes to numbers and spreadsheets.
Many companies overlook the value of qualitative data, but in reality, there are untold insights to be gained from what people (especially customers) write and say about you. So how do you go about analyzing textual data?
One highly useful qualitative technique is sentiment analysis , a technique which belongs to the broader category of text analysis —the (usually automated) process of sorting and understanding textual data.
With sentiment analysis, the goal is to interpret and classify the emotions conveyed within textual data. From a business perspective, this allows you to ascertain how your customers feel about various aspects of your brand, product, or service.
There are several different types of sentiment analysis models, each with a slightly different focus. The three main types include:
Fine-grained sentiment analysis
If you want to focus on opinion polarity (i.e. positive, neutral, or negative) in depth, fine-grained sentiment analysis will allow you to do so.
For example, if you wanted to interpret star ratings given by customers, you might use fine-grained sentiment analysis to categorize the various ratings along a scale ranging from very positive to very negative.
Emotion detection
This model often uses complex machine learning algorithms to pick out various emotions from your textual data.
You might use an emotion detection model to identify words associated with happiness, anger, frustration, and excitement, giving you insight into how your customers feel when writing about you or your product on, say, a product review site.
Aspect-based sentiment analysis
This type of analysis allows you to identify what specific aspects the emotions or opinions relate to, such as a certain product feature or a new ad campaign.
If a customer writes that they “find the new Instagram advert so annoying”, your model should detect not only a negative sentiment, but also the object towards which it’s directed.
In a nutshell, sentiment analysis uses various Natural Language Processing (NLP) algorithms and systems which are trained to associate certain inputs (for example, certain words) with certain outputs.
For example, the input “annoying” would be recognized and tagged as “negative”. Sentiment analysis is crucial to understanding how your customers feel about you and your products, for identifying areas for improvement, and even for averting PR disasters in real-time!
Sentiment analysis in action: 5 Real-world sentiment analysis case studies
4. The data analysis process
In order to gain meaningful insights from data, data analysts will perform a rigorous step-by-step process. We go over this in detail in our step by step guide to the data analysis process —but, to briefly summarize, the data analysis process generally consists of the following phases:
Defining the question
The first step for any data analyst will be to define the objective of the analysis, sometimes called a ‘problem statement’. Essentially, you’re asking a question with regards to a business problem you’re trying to solve. Once you’ve defined this, you’ll then need to determine which data sources will help you answer this question.
Collecting the data
Now that you’ve defined your objective, the next step will be to set up a strategy for collecting and aggregating the appropriate data. Will you be using quantitative (numeric) or qualitative (descriptive) data? Do these data fit into first-party, second-party, or third-party data?
Learn more: Quantitative vs. Qualitative Data: What’s the Difference?
Cleaning the data
Unfortunately, your collected data isn’t automatically ready for analysis—you’ll have to clean it first. As a data analyst, this phase of the process will take up the most time. During the data cleaning process, you will likely be:
- Removing major errors, duplicates, and outliers
- Removing unwanted data points
- Structuring the data—that is, fixing typos, layout issues, etc.
- Filling in major gaps in data
Analyzing the data
Now that we’ve finished cleaning the data, it’s time to analyze it! Many analysis methods have already been described in this article, and it’s up to you to decide which one will best suit the assigned objective. It may fall under one of the following categories:
- Descriptive analysis , which identifies what has already happened
- Diagnostic analysis , which focuses on understanding why something has happened
- Predictive analysis , which identifies future trends based on historical data
- Prescriptive analysis , which allows you to make recommendations for the future
Visualizing and sharing your findings
We’re almost at the end of the road! Analyses have been made, insights have been gleaned—all that remains to be done is to share this information with others. This is usually done with a data visualization tool, such as Google Charts, or Tableau.
Learn more: 13 of the Most Common Types of Data Visualization
To sum up the process, Will’s explained it all excellently in the following video:
5. The best tools for data analysis
As you can imagine, every phase of the data analysis process requires the data analyst to have a variety of tools under their belt that assist in gaining valuable insights from data. We cover these tools in greater detail in this article , but, in summary, here’s our best-of-the-best list, with links to each product:
The top 9 tools for data analysts
- Microsoft Excel
- Jupyter Notebook
- Apache Spark
- Microsoft Power BI
6. Key takeaways and further reading
As you can see, there are many different data analysis techniques at your disposal. In order to turn your raw data into actionable insights, it’s important to consider what kind of data you have (is it qualitative or quantitative?) as well as the kinds of insights that will be useful within the given context. In this post, we’ve introduced seven of the most useful data analysis techniques—but there are many more out there to be discovered!
So what now? If you haven’t already, we recommend reading the case studies for each analysis technique discussed in this post (you’ll find a link at the end of each section). For a more hands-on introduction to the kinds of methods and techniques that data analysts use, try out this free introductory data analytics short course. In the meantime, you might also want to read the following:
- The Best Online Data Analytics Courses for 2024
- What Is Time Series Data and How Is It Analyzed?
- What is Spatial Analysis?
- Business Essentials
- Leadership & Management
- Credential of Leadership, Impact, and Management in Business (CLIMB)
- Entrepreneurship & Innovation
- Digital Transformation
- Finance & Accounting
- Business in Society
- For Organizations
- Support Portal
- Media Coverage
- Founding Donors
- Leadership Team

- Harvard Business School →
- HBS Online →
- Business Insights →
Business Insights
Harvard Business School Online's Business Insights Blog provides the career insights you need to achieve your goals and gain confidence in your business skills.
- Career Development
- Communication
- Decision-Making
- Earning Your MBA
- Negotiation
- News & Events
- Productivity
- Staff Spotlight
- Student Profiles
- Work-Life Balance
- AI Essentials for Business
- Alternative Investments
- Business Analytics
- Business Strategy
- Business and Climate Change
- Creating Brand Value
- Design Thinking and Innovation
- Digital Marketing Strategy
- Disruptive Strategy
- Economics for Managers
- Entrepreneurship Essentials
- Financial Accounting
- Global Business
- Launching Tech Ventures
- Leadership Principles
- Leadership, Ethics, and Corporate Accountability
- Leading Change and Organizational Renewal
- Leading with Finance
- Management Essentials
- Negotiation Mastery
- Organizational Leadership
- Power and Influence for Positive Impact
- Strategy Execution
- Sustainable Business Strategy
- Sustainable Investing
- Winning with Digital Platforms
4 Ways to Improve Your Analytical Skills

- 07 Jan 2021
Data is ubiquitous. It’s collected at every purchase made, flight taken, ad clicked, and social media post liked—which means it’s never been more crucial to understand how to analyze it.
“Never before has so much data about so many different things been collected and stored every second of every day,” says Harvard Business School Professor Jan Hammond in the online course Business Analytics .
The volume of data you encounter can be overwhelming and raise several questions: Can I trust the data’s source? Is it structured in a way that makes sense? What story does it tell, and what actions does it prompt?
Data literacy and analytical skills can enable you to answer these questions and not only make sense of raw data, but use it to drive impactful change at your organization.
Here’s a look at what it means to be data literate and four ways to improve your analytical skills.
Access your free e-book today.
What Is Data Literacy?
Data literacy is the ability to analyze, interpret, and question data. A dataset is made up of numerous data points that, when viewed together, tell a story.
Before conducting an analysis, it’s important to ensure your data’s quality and structure is in accordance with your organization’s needs.
“In order to transform data into actionable information, you first need to evaluate its quality,” says Professor Dustin Tingley in the Harvard Online course Data Science Principles . “But evaluating the quality of your data is just the first step. You’ll also need to structure your data. Without structure, it’s nearly impossible to extract any information.”
When you’re able to look at quality data, structure it, and analyze it, trends emerge. The next step is to reflect on your analysis and take action.
Tingley shares several questions to ask yourself once you’ve analyzed your dataset: “Did all the steps I took make sense? If so, how should I respond to my analysis? If not, what should I go back and improve?”
For example, you may track users who click a button to download an e-book from your website.
After ensuring your data’s quality and structuring it in a way that makes sense, you begin your analysis and find that a user’s age is positively correlated with their likelihood to click. What story does this trend tell? What does it say about your users, product offering, and business strategy?
To answer these questions, you need strong analytical skills, which you can develop in several ways.
Related: Business Analytics: What It Is & Why It’s Important
How to Improve Your Analytical Skills
Analysis is an important skill to have in any industry because it enables you to support decisions with data, learn more about your customers, and predict future trends.
Key analytical skills for business include:
- Visualizing data
- Determining the relationship between two or more variables
- Forming and testing hypotheses
- Performing regressions using statistical programs, such as Microsoft Excel
- Deriving actionable conclusions from data analysis
If you want to provide meaningful conclusions and data-based recommendations to your team, here are four ways to bolster your analytical skills.
Related: How to Learn Business Analytics Without A Business Background
1. Consider Opposing Viewpoints
While engaging with opposing viewpoints can help you expand your perspective, combat bias, and show your fellow employees their opinions are valued, it can also be a useful way to practice analytical skills.
When analyzing data, it’s crucial to consider all possible interpretations and avoid getting stuck in one way of thinking.
For instance, revisit the example of tracking users who click a button on your site to download an e-book. The data shows that the user’s age is positively correlated with their likelihood to click the button; as age increases, downloads increase, too. At first glance, you may interpret this trend to mean that a user chooses to download the e-book because of their age.
This conclusion, however, doesn’t take into consideration the vast number of variables that change with age. For instance, perhaps the real reason your older users are more likely to download the e-book is their higher level of responsibility at work, higher average income, or higher likelihood of being parents.
This example illustrates the need to consider multiple interpretations of data, and specifically shows the difference between correlation (the trending of two or more variables in the same direction) and causation (when a trend in one variable causes a trend to occur in one or more other variables).
“Data science is built on a foundation of critical thinking,” Tingley says in Data Science Principles . “From the first step of determining the quality of a data source to determining the accuracy of an algorithm, critical thinking is at the heart of every decision data scientists—and those who work with them—make.”
To practice this skill, challenge yourself to question your assumptions and ask others for their opinions. The more you actively engage with different viewpoints, the less likely you are to get stuck in a one-track mindset when analyzing data.
2. Play Games or Brain Teasers
If you’re looking to sharpen your skills on a daily basis, there are many simple, enjoyable ways to do so.
Games, puzzles, and stories that require visualizing relationships between variables, examining situations from multiple angles, and drawing conclusions from known data points can help you build the skills necessary to analyze data.
Some fun ways to practice analytical thinking include:
- Crossword puzzles
- Mystery novels
- Logic puzzles
- Strategic board games or card games
These options can supplement your analytics coursework and on-the-job experience. Some of them also allow you to spend time with friends or family. Try engaging with one each day to hone your analytical mindset.
Related: 3 Examples of Business Analytics in Action
3. Take an Online Analytics Course
Whether you want to learn the basics, brush up on your skills, or expand your knowledge, taking an analytics course is an effective way to improve. A course can enable you to focus on the content you want to learn, engage with the material presented by a professional in the field, and network and interact with others in the data analytics space.
For a beginner, courses like Harvard Online's Data Science Principles can provide a foundation in the language of data. A more advanced course, like Harvard Online's Data Science for Business , may be a fit if you’re looking to explore specific facets of analytics, such as forecasting and machine learning. If you’re interested in hands-on applications of analytical formulas, a course like HBS Online's Business Analytics could be right for you. The key is to understand what skills you hope to gain, then find a course that best fits your needs.
If you’re balancing a full-time job with your analytics education, an online format may be a good choice . It offers the flexibility to engage with course content whenever and wherever is most convenient for you.
An online course may also present the opportunity to network and build relationships with other professionals devoted to strengthening their analytical skills. A community of like-minded learners can prove to be an invaluable resource as you learn and advance your career.
Related: Is An Online Business Analytics Course Worth It?
4. Engage With Data
Once you have a solid understanding of data science concepts and formulas, the next step is to practice. Like any skill, analytical skills improve the more you use them.
Mock datasets—which you can find online or create yourself—present a low-risk option for putting your skills to the test. Import the data into Microsoft Excel, then explore: make mistakes, try that formula you’re unsure of, and ask big questions of your dataset. By testing out different analyses, you can gain confidence in your knowledge.
Once you’re comfortable, engage with your organization’s data. Because these datasets have inherent meaning to your business's financial health, growth, and strategic direction, analyzing them can produce evidence and insights that support your decisions and drive change at your organization.

Investing in Your Data Literacy
As data continues to be one of businesses’ most valuable resources, taking the time and effort to build and bolster your analytical skill set is vital.
“Much more data are going to be available; we’re only seeing the beginning now,” Hammond says in a previous article . “If you don’t use the data, you’re going to fall behind. People that have those capabilities—as well as an understanding of business contexts—are going to be the ones that will add the most value and have the greatest impact.”
Are you interested in furthering your data literacy? Download our Beginner’s Guide to Data & Analytics to learn how you can leverage the power of data for professional and organizational success.

About the Author
How it works
Transform your enterprise with the scalable mindsets, skills, & behavior change that drive performance.
Explore how BetterUp connects to your core business systems.
We pair AI with the latest in human-centered coaching to drive powerful, lasting learning and behavior change.
Build leaders that accelerate team performance and engagement.
Unlock performance potential at scale with AI-powered curated growth journeys.
Build resilience, well-being and agility to drive performance across your entire enterprise.
Transform your business, starting with your sales leaders.
Unlock business impact from the top with executive coaching.
Foster a culture of inclusion and belonging.
Accelerate the performance and potential of your agencies and employees.
See how innovative organizations use BetterUp to build a thriving workforce.
Discover how BetterUp measurably impacts key business outcomes for organizations like yours.
Daring Leadership Institute: a groundbreaking partnership that amplifies Brené Brown's empirically based, courage-building curriculum with BetterUp’s human transformation platform.

- What is coaching?
Learn how 1:1 coaching works, who its for, and if it's right for you.
Accelerate your personal and professional growth with the expert guidance of a BetterUp Coach.
Types of Coaching
Navigate career transitions, accelerate your professional growth, and achieve your career goals with expert coaching.
Enhance your communication skills for better personal and professional relationships, with tailored coaching that focuses on your needs.
Find balance, resilience, and well-being in all areas of your life with holistic coaching designed to empower you.
Discover your perfect match : Take our 5-minute assessment and let us pair you with one of our top Coaches tailored just for you.
Find your coach
-1.png "analytical problem solving tools")
Research, expert insights, and resources to develop courageous leaders within your organization.
Best practices, research, and tools to fuel individual and business growth.
View on-demand BetterUp events and learn about upcoming live discussions.
The latest insights and ideas for building a high-performing workplace.
- BetterUp Briefing
The online magazine that helps you understand tomorrow's workforce trends, today.
Innovative research featured in peer-reviewed journals, press, and more.
Founded in 2022 to deepen the understanding of the intersection of well-being, purpose, and performance
We're on a mission to help everyone live with clarity, purpose, and passion.
Join us and create impactful change.
Read the buzz about BetterUp.
Meet the leadership that's passionate about empowering your workforce.

For Business
For Individuals

What are analytical skills? Examples and how to level up

Jump to section
What are analytical skills?
Why are analytical skills important, 9 analytical skills examples, how to improve analytical skills, how to show analytical skills in a job application, the benefits of an analytical mind.
With market forecasts, performance metrics, and KPIs, work throws a lot of information at you.
If you want to stay ahead of the curve, not only do you have to make sense of the data that comes your way — you need to put it to good use. And that requires analytical skills.
You likely use analytical thinking skills every day without realizing it, like when you solve complex problems or prioritize tasks . But understanding the meaning of analysis skills in a job description, why you should include them in your professional development plan, and what makes them vital to every position can help advance your career.
Analytical skills, or analysis skills, are the ones you use to research and interpret information. Although you might associate them with data analysis, they help you think critically about an issue, make decisions , and solve problems in any context. That means anytime you’re brainstorming for a solution or reviewing a project that didn’t go smoothly, you’re analyzing information to find a conclusion. With so many applications, they’re relevant for nearly every job, making them a must-have on your resume.
Analytical skills help you think objectively about information and come to informed conclusions. Positions that consider these skills the most essential qualification grew by 92% between 1980 and 2018 , which shows just how in-demand they are. And according to Statista, global data creation will grow to more than 180 zettabytes by 2025 — a number with 21 zeros. That data informs every industry, from tech to marketing.
Even if you don’t interact with statistics and data on the job, you still need analytical skills to be successful. They’re incredibly valuable because:
- They’re transferable: You can use analysis skills in a variety of professional contexts and in different areas of your life, like making major decisions as a family or setting better long-term personal goals.
- They build agility: Whether you’re starting a new position or experiencing a workplace shift, analysis helps you understand and adapt quickly to changing conditions.
- They foster innovation: Analytical skills can help you troubleshoot processes or operational improvements that increase productivity and profitability.
- They make you an attractive candidate: Companies are always looking for future leaders who can build company value. Developing a strong analytical skill set shows potential employers that you’re an intelligent, growth-oriented candidate.
If the thought of evaluating data feels unintuitive, or if math and statistics aren’t your strong suits, don’t stress. Many examples of analytical thinking skills don’t involve numbers. You can build your logic and analysis abilities through a variety of capacities, such as:
1. Brainstorming
Using the information in front of you to generate new ideas is a valuable transferable skill that helps you innovate at work . Developing your brainstorming techniques leads to better collaboration and organizational growth, whether you’re thinking of team bonding activities or troubleshooting a project roadblock. Related skills include benchmarking, diagnosis, and judgment to adequately assess situations and find solutions.
2. Communication
Becoming proficient at analysis is one thing, but you should also know how to communicate your findings to your audience — especially if they don’t have the same context or experience as you. Strong communication skills like public speaking , active listening , and storytelling can help you strategize the best ways to get the message out and collaborate with your team . And thinking critically about how to approach difficult conversations or persuade someone to see your point relies on these skills.
3. Creativity
You might not associate analysis with your creativity skills, but if you want to find an innovative approach to an age-old problem, you’ll need to combine data with creative thinking . This can help you establish effective metrics, spot trends others miss, and see why the most obvious answer to a problem isn’t always the best. Skills that can help you to think outside the box include strategic planning, collaboration, and integration.

4. Critical thinking
Processing information and determining what’s valuable requires critical thinking skills . They help you avoid the cognitive biases that prevent innovation and growth, allowing you to see things as they really are and understand their relevance. Essential skills to turn yourself into a critical thinker are comparative analysis, business intelligence, and inference.
5. Data analytics
When it comes to large volumes of information, a skilled analytical thinker can sort the beneficial from the irrelevant. Data skills give you the tools to identify trends and patterns and visualize outcomes before they impact an organization or project’s performance. Some of the most common skills you can develop are prescriptive analysis and return on investment (ROI) analysis.
6. Forecasting
Predicting future business, market, and cultural trends better positions your organization to take advantage of new opportunities or prepare for downturns. Business forecasting requires a mix of research skills and predictive abilities, like statistical analysis and data visualization, and the ability to present your findings clearly.
7. Logical reasoning
Becoming a logical thinker means learning to observe and analyze situations to draw rational and objective conclusions. With logic, you can evaluate available facts, identify patterns or correlations, and use them to improve decision-making outcomes. If you’re looking to improve in this area, consider developing inductive and deductive reasoning skills.
8. Problem-solving
Problem-solving appears in all facets of your life — not just work. Effectively finding solutions to any issue takes analysis and logic, and you also need to take initiative with clear action plans . To improve your problem-solving skills , invest in developing visualization , collaboration, and goal-setting skills.
9. Research
Knowing how to locate information is just as valuable as understanding what to do with it. With research skills, you’ll recognize and collect data relevant to the problem you’re trying to solve or the initiative you’re trying to start. You can improve these skills by learning about data collection techniques, accuracy evaluation, and metrics.

You don’t need to earn a degree in data science to develop these skills. All it takes is time, practice, and commitment. Everything from work experience to hobbies can help you learn new things and make progress. Try a few of these ideas and stick with the ones you enjoy:
1. Document your skill set
The next time you encounter a problem and need to find solutions, take time to assess your process. Ask yourself:
- What facts are you considering?
- Do you ask for help or research on your own? What are your sources of advice?
- What does your brainstorming process look like?
- How do you make and execute a final decision?
- Do you reflect on the outcomes of your choices to identify lessons and opportunities for improvement?
- Are there any mistakes you find yourself making repeatedly?
- What problems do you constantly solve easily?
These questions can give insight into your analytical strengths and weaknesses and point you toward opportunities for growth.
2. Take courses
Many online and in-person courses can expand your logical thinking and analysis skills. They don’t necessarily have to involve information sciences. Just choose something that trains your brain and fills in your skills gaps .
Consider studying philosophy to learn how to develop your arguments or public speaking to better communicate the results of your research. You could also work on your hard skills with tools like Microsoft Excel and learn how to crunch numbers effectively. Whatever you choose, you can explore different online courses or certification programs to upskill.
3. Analyze everything
Spend time consciously and critically evaluating everything — your surroundings, work processes, and even the way you interact with others. Integrating analysis into your day-to-day helps you practice. The analytical part of your brain is like a muscle, and the more you use it, the stronger it’ll become.
After reading a book, listening to a podcast, or watching a movie, take some time to analyze what you watched. What were the messages? What did you learn? How was it delivered? Taking this approach to media will help you apply it to other scenarios in your life.
If you’re giving a presentation at work or helping your team upskill , use the opportunity to flex the analytical side of your brain. For effective teaching, you’ll need to process and analyze the topic thoroughly, which requires skills like logic and communication. You also have to analyze others’ learning styles and adjust your teachings to match them.
5. Play games
Spend your commute or weekends working on your skills in a way you enjoy. Try doing logic games like Sudoku and crossword puzzles during work breaks to foster critical thinking. And you can also integrate analytical skills into your existing hobbies. According to researcher Rakesh Ghildiyal, even team sports like soccer or hockey will stretch your capacity for analysis and strategic thinking .
6. Ask questions
According to a study in Tr ends in Cognitive Sciences, being curious improves cognitive function , helping you develop problem-solving skills, retention, and memory. Start speaking up in meetings and questioning the why and how of different decisions around you. You’ll think more critically and even help your team find breakthrough solutions they otherwise wouldn’t.
7.Seek advice
If you’re unsure what analytical skills you need to develop, try asking your manager or colleagues for feedback . Their outside perspective offers insight you might not find within, like patterns in. And if you’re looking for more consistent guidance, talking to a coach can help you spot weaknesses and set goals for the long term.
8. Pursue opportunities
Speak to your manager about participating in special projects that could help you develop and flex your skills. If you’d like to learn about SEO or market research, ask to shadow someone in the ecommerce or marketing departments. If you’re interested in business forecasting, talk to the data analysis team. Taking initiative demonstrates a desire to learn and shows leadership that you’re eager to grow.

Shining a spotlight on your analytical skills can help you at any stage of your job search. But since they take many forms, it’s best to be specific and show potential employers exactly why and how they make you a better candidate. Here are a few ways you can showcase them to the fullest:
1. In your cover letter
Your cover letter crafts a narrative around your skills and work experience. Use it to tell a story about how you put your analytical skills to use to solve a problem or improve workflow. Make sure to include concrete details to explain your thought process and solution — just keep it concise. Relate it back to the job description to show the hiring manager or recruiter you have the qualifications necessary to succeed.
2. On your resume
Depending on the type of resume you’re writing, there are many opportunities to convey your analytical skills to a potential employer. You could include them in sections like:
- Professional summary: If you decide to include a summary, describe yourself as an analytical person or a problem-solver, whichever relates best to the job posting.
- Work experience: Describe all the ways your skill for analysis has helped you perform or go above and beyond your responsibilities. Be sure to include specific details about challenges and outcomes related to the role you’re applying for to show how you use those skills.
- Skills section: If your resume has a skill-specific section, itemize the analytical abilities you’ve developed over your career. These can include hard analytical skills like predictive modeling as well as interpersonal skills like communication.
3. During a job interview
As part of your interview preparation , list your professional accomplishments and the skills that helped along the way, such as problem-solving, data literacy, or strategic thinking. Then, pull them together into confident answers to common interview questions using the STAR method to give the interviewer a holistic picture of your skill set.
Developing analytical skills isn’t only helpful in the workplace. It’s essential to life. You’ll use them daily whenever you read the news, make a major purchase, or interact with others. Learning to critically evaluate information can benefit your relationships and help you feel more confident in your decisions, whether you’re weighing your personal budget or making a big career change .
Understand Yourself Better:
Big 5 Personality Test
Elizabeth Perry, ACC
Elizabeth Perry is a Coach Community Manager at BetterUp. She uses strategic engagement strategies to cultivate a learning community across a global network of Coaches through in-person and virtual experiences, technology-enabled platforms, and strategic coaching industry partnerships. With over 3 years of coaching experience and a certification in transformative leadership and life coaching from Sofia University, Elizabeth leverages transpersonal psychology expertise to help coaches and clients gain awareness of their behavioral and thought patterns, discover their purpose and passions, and elevate their potential. She is a lifelong student of psychology, personal growth, and human potential as well as an ICF-certified ACC transpersonal life and leadership Coach.
20 examples of development opportunities that can level up your career
A roadmap for career development: how to set your course, create a networking plan in 7 easy steps, discover how to get noticed by upper management at work, are you being passed over for a promotion here’s what to do, what business acumen is and 9 ways to develop it, 8 examples for setting professional development goals at work, professional development is for everyone (we’re looking at you), how to pursue jobs versus careers to achieve different goals, how to develop critical thinking skills, why we're facing a crisis of imagination, and how to overcome it, 10 essential business skills that make an impact on your career, what are hard skills & examples for your resume, use a personal swot analysis to discover your strengths and weaknesses, 17 essential transferable skills to boost your job search, critical thinking is the one skillset you can't afford not to master, what are metacognitive skills examples in everyday life, stay connected with betterup, get our newsletter, event invites, plus product insights and research..
3100 E 5th Street, Suite 350 Austin, TX 78702
- Platform Overview
- Integrations
- Powered by AI
- BetterUp Lead™
- BetterUp Manage™
- BetterUp Care®
- Sales Performance
- Diversity & Inclusion
- Case Studies
- Why BetterUp?
- About Coaching
- Find your Coach
- Career Coaching
- Communication Coaching
- Personal Coaching
- News and Press
- Leadership Team
- Become a BetterUp Coach
- BetterUp Labs
- Center for Purpose & Performance
- Leadership Training
- Business Coaching
- Contact Support
- Contact Sales
- Privacy Policy
- Acceptable Use Policy
- Trust & Security
- Cookie Preferences
IMAGES
VIDEO
COMMENTS
It is the heart of problem-solving. Root cause analysis is the second important element of problem-solving in quality management. The reason is if you don't know what the problem is, you can never solve the exact problem that is hurting the quality. Manufacturers have a variety of problem-solving tools at hand.
Failure Mode and Effects Analysis (FMEA) 5. PROACT® RCA Method. 6. Affinity Diagram. 7. Fault Tree Analysis (FTA) With over two decades in business - spanning strategy consulting, tech startups and executive leadership - I am committed to helping your organization thrive. At Reliability, we're on a mission to help enhance strategic ...
The problem solving tools include three unique categories: problem solving diagrams, problem solving mind maps, and problem solving software solutions. They include: Fishbone diagrams. Flowcharts. Strategy maps. Mental maps. Idea maps. Concept maps. Layered process audit software.
Before jumping in, it's crucial to plan the analysis, decide which analytical tools to use, and ensure rigor. Check out these insights to uncover ways data can take your problem-solving techniques to the next level, and stay tuned for an upcoming post on the potential power of generative AI in problem-solving. The data-driven enterprise of 2025.
Visualizes interrelated causes. Prioritizes problem-solving efforts. 3. Failure Mode and Effects Analysis (FMEA): Anticipating the What-Ifs. Failure Mode and Effects Analysis (FMEA) Failure Mode and Effects Analysis (FMEA) serves as a proactive tool for anticipating potential failures and their impacts on business operations.
Capterra: 4.7/5 (2,000+ reviews) 2. Intelex Root Cause Analysis Software. via Intelex. The Root Cause Analysis Software from Intelex is a SaaS tool designed to help companies create better environment, health, safety, and quality (EHSC) procedures. It uses various methodologies to get to the root cause of the problem.
Problem analysis can be one of the most important and decisive stages of all problem-solving tools. Sometimes, a team can become bogged down in the details and are unable to move forward. Journalists is an activity that can avoid a group from getting stuck in the problem identification or problem analysis stages of the process.
Next to accurately defining a problem, root cause analysis (RCA) is one of the most important elements of problem-solving in quality management. Effective RCA ensures that the actual cause of a problem is identified and addressed, preventing recurrence. This is where methodologies like Six Sigma, with its DMAIC (Define, Measure, Analyze ...
Root Cause Analysis is a useful process for understanding and solving a problem. Figure out what negative events are occurring. Then, look at the complex systems around those problems, and identify key points of failure. Finally, determine solutions to address those key points, or root causes. You can use many tools to support your RCA process.
When it comes to problem-solving there are seven key steps that you should follow: define the problem, disaggregate, prioritize problem branches, create an analysis plan, conduct analysis, synthesis, and communication. 1. Define the problem. Problem-solving begins with a clear understanding of the issue at hand.
Root Cause Analysis is a useful process for understanding and solving a problem. Figure out what negative events are occurring. Then, look at the complex systems around those problems, and identify key points of failure. Finally, determine solutions to address those key points, or root causes. You can use many tools to support your RCA process.
Minitab provides a multitude of solutions for engineers to aid in problem solving and analytics. Attack problems with brainstorming tools, plan projects and process improvements through visual tools, and then collect data and analyze it, all within the Minitab ecosystem. Our solutions can help you find the answers you need using graphical tools ...
The 5 Whys strategy is a simple, effective tool for uncovering the root of a problem. You can use it in troubleshooting, problem-solving, and quality-improvement initiatives. Start with a problem and ask why it is occurring. Make sure that your answer is grounded in fact, and then ask the question again.
What is Problem Solving? Steps, Process & Techniques
The data analysis process; The best tools for data analysis Key takeaways; The first six methods listed are used for quantitative data, while the last technique applies to qualitative data. We briefly explain the difference between quantitative and qualitative data in section two, but if you want to skip straight to a particular analysis ...
What is a Fishbone Diagram? Ishikawa Cause ... - ASQ
What is Root Cause Analysis (RCA)?
How to master the seven-step problem-solving process
4 Ways to Improve Your Analytical Skills - HBS Online
The McKinsey guide to problem solving. Become a better problem solver with insights and advice from leaders around the world on topics including developing a problem-solving mindset, solving problems in uncertain times, problem solving with AI, and much more.
This course teaches you how to use a fishbone diagram as a problem-solving tool. It allows you to organize and classify your organizational challenges into an analytical and actionable system. Simple quality tools can help you solve many problems. Learn how to organize and categorize potential problem causes using a fishbone diagram.
What Are Analytical Skills? 9 Examples & Tips to Improve
Planned future work includes extending these tools to more courses, maintaining the segmented rubric as the primary tool for complex problem-solving, refining the checklist criteria with professional input, and gathering feedback from students and educators. This feedback will help optimise the assessment process.